

Question: 75 . The partial me gastar output below is regression analysis of the relationship between annual payroll and number of wins in a season for
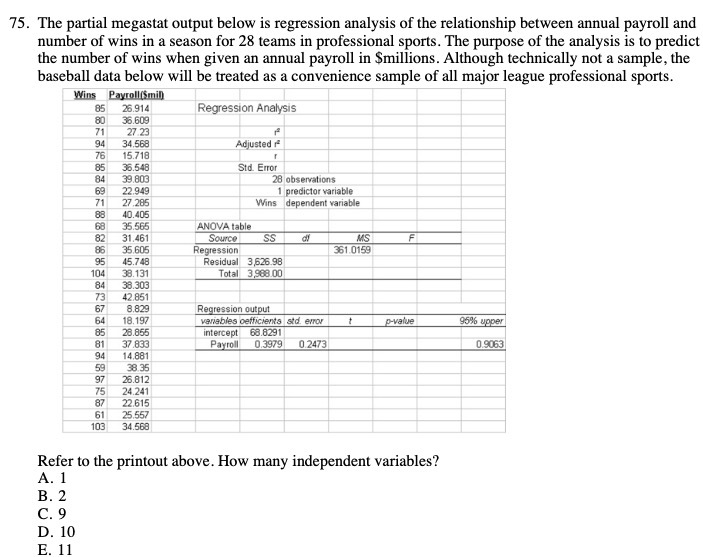
75 . The partial me gastar output below is regression analysis of the relationship between annual payroll and number of wins in a season for 28 teams in professional sports . The purpose of the analysis is to predict the number of wills when given an annual payroll in Smillions . Although technically not a sample , the baseball data below will be treated as a convenience sample of all major league professional sports . Wing Payrolllimit 25. 91 {| Regression Anal,515 35.5019 TI 27.73 $14 34.560 15.718 Adjusted ^ 35. 548 39. 8013 Sitd Error 28 observations 72:349 I predictor variable* 27. 205 Whing dependent variable |1 BE $1. 105 35.565 ANOVA table* 31. 461 MS 75. 605 {Egression 351.0159 95 45.740 Residual 3,626.5 8 1014 38.131 Total 3503\\} 35. 303 42 .651 EL ET 8 . 829 Regression output 18 . 197 variables Deficient's sid Error q-value* $15 28. 655 intercept [S.$291 37.$1.93 Payroll 0.3979 \\0.2473 59 14 . 8BY 97 38. 35 25. 812 75 24.241 22.615 25.557 19 34. 56.0 Refer to the printout above . How many independent variables ?! A. I B. 2 C. ` D . 10 $. 1 1
Step by Step Solution
There are 3 Steps involved in it

Get step-by-step solutions from verified subject matter experts