

Question: 7:55 2 ut. 98% Consider the following example. The quarterly sales for specific educational software over the past three years are given in the following
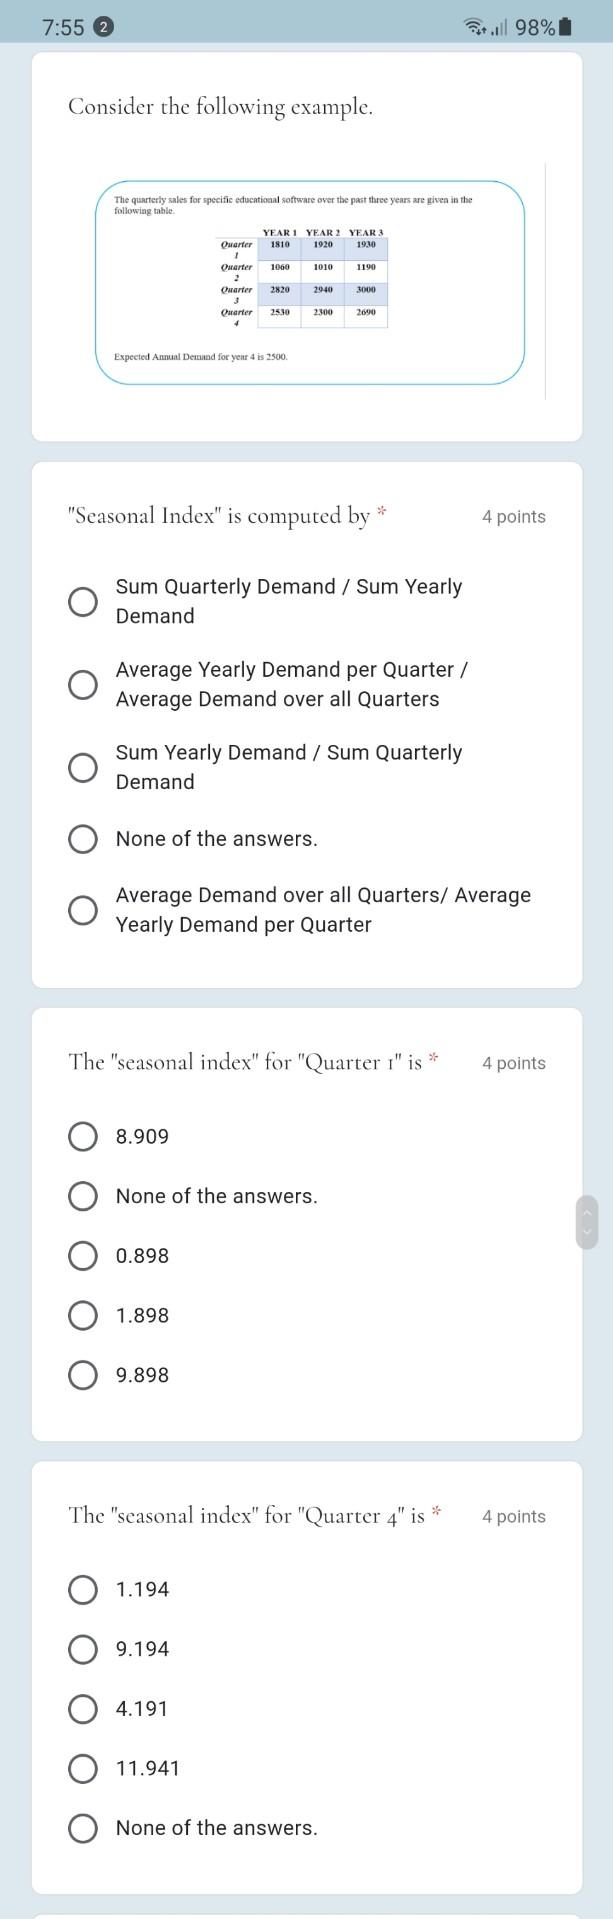
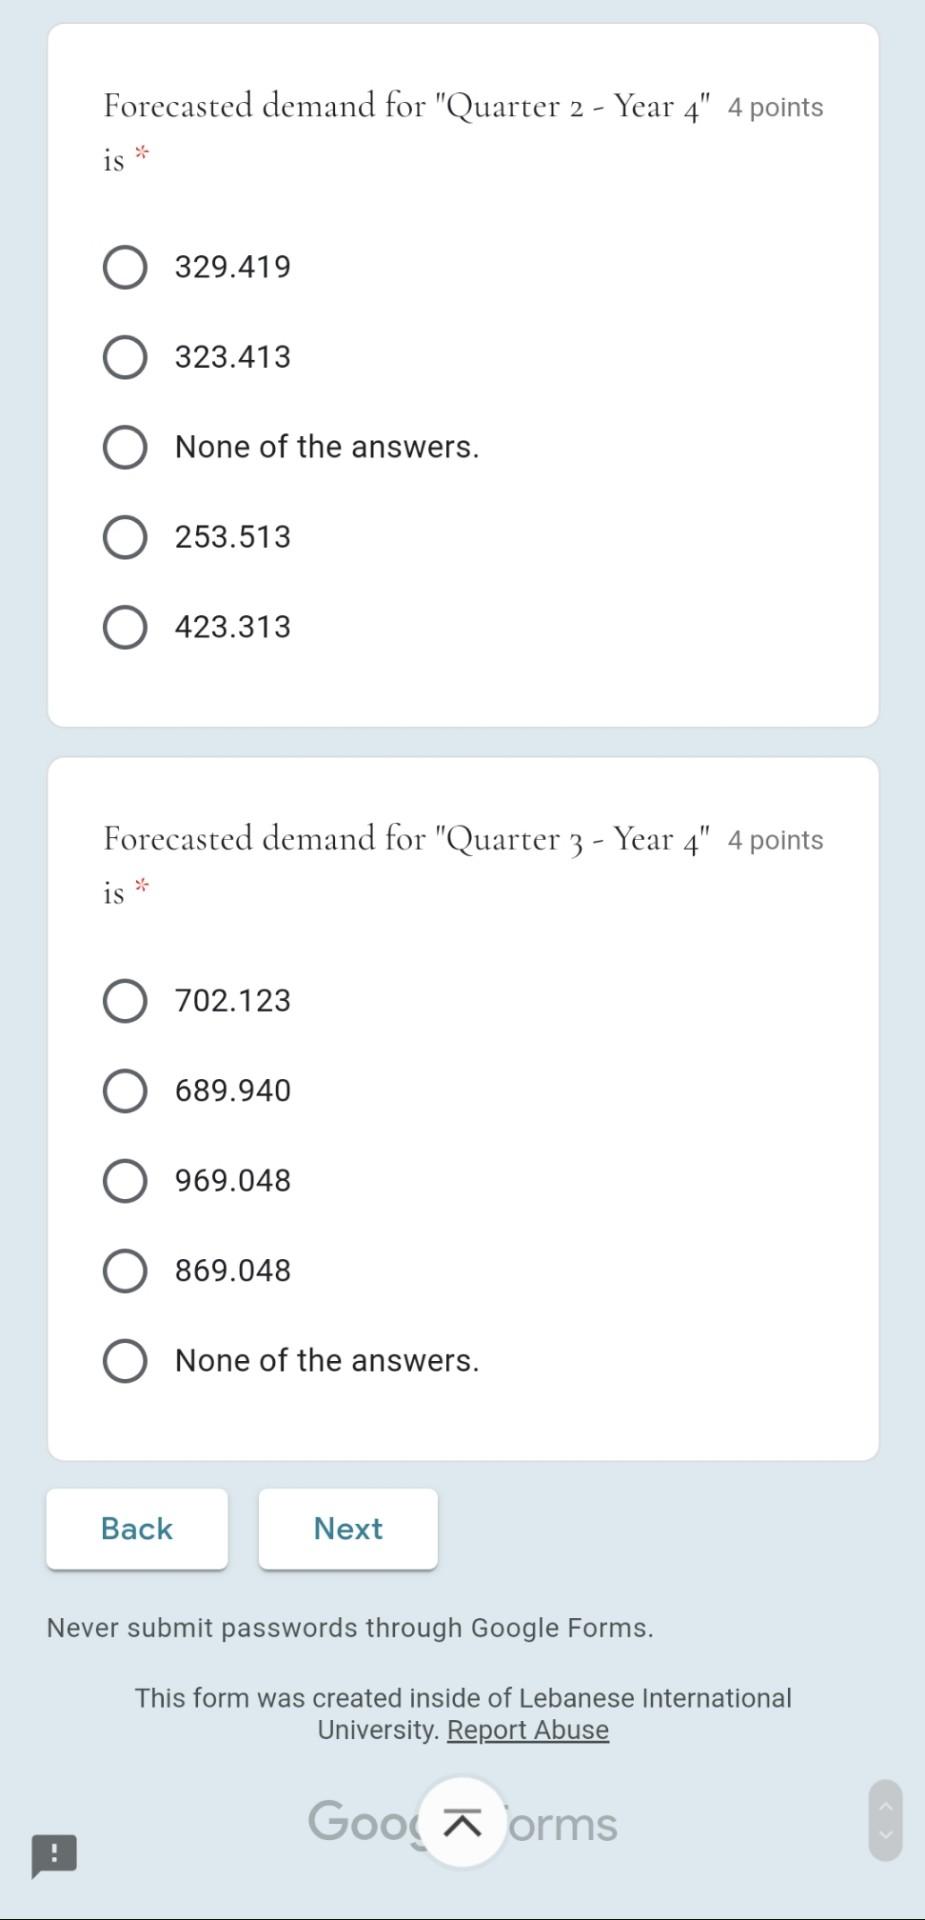
7:55 2 ut. 98% Consider the following example. The quarterly sales for specific educational software over the past three years are given in the following table YEAR 1 YEAR 2 YEAR 3 1810 1920 1900 Quarter Ouarter 1060 1010 Quarter 2820 2940 3000 Ouarter 2530 2300 2000 Expected Annual Demand for your 4 is 2500. "Seasonal Index" is computed by * 4 points Sum Quarterly Demand / Sum Yearly Demand Average Yearly Demand per Quarter / Average Demand over all Quarters Sum Yearly Demand / Sum Quarterly Demand None of the answers. Average Demand over all Quarters/ Average Yearly Demand per Quarter The "seasonal index" for "Quarter " is * 4 points 8.909 None of the answers. 0.898 1.898 9.898 The "seasonal index" for "Quarter 4" is * 4 points 1.194 9.194 4.191 11.941 None of the answers. Forecasted demand for "Quarter 2 - Year 4" 4 points is * 329.419 323.413 None of the answers. 253.513 O 423.313 Forecasted demand for "Quarter 3 - Year 4" 4 points is * 702.123 689.940 969.048 869.048 None of the answers. Back Next Never submit passwords through Google Forms. This form was created inside of Lebanese International University. Report Abuse Gooi orms
Step by Step Solution
There are 3 Steps involved in it
1 Expert Approved Answer
Step: 1 Unlock

Question Has Been Solved by an Expert!
Get step-by-step solutions from verified subject matter experts
Step: 2 Unlock
Step: 3 Unlock