

Question: 767 C 12 total contribution 57.72% The below chart shows selling and inventory data for classes within the Footwear department from last week. Use the
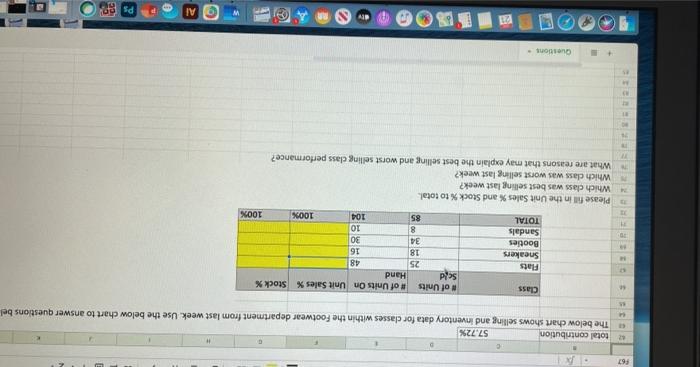
767 C 12 total contribution 57.72% The below chart shows selling and inventory data for classes within the Footwear department from last week. Use the below chart to answer questions bel Class Flats Sneakers Booties # of Units # of Units On Unit Sales Stock Seed Hand 25 48 18 16 34 30 8 10 85 104 100% 100% 30 Sandals TOTAL Please fill in the Unit Sales and Stock % to total Which class was best selling last week? Which class was worst selling last week? What are reasons that may explain the best selling and worst selling class performance? Questions elv Ps
Step by Step Solution
There are 3 Steps involved in it
1 Expert Approved Answer
Step: 1 Unlock

Question Has Been Solved by an Expert!
Get step-by-step solutions from verified subject matter experts
Step: 2 Unlock
Step: 3 Unlock