

Question: 7.Listed below are results from two different tests designed to measure productivity and dexterity for randomly selected employees. Productivity(x) 23 25 28 21 21 25
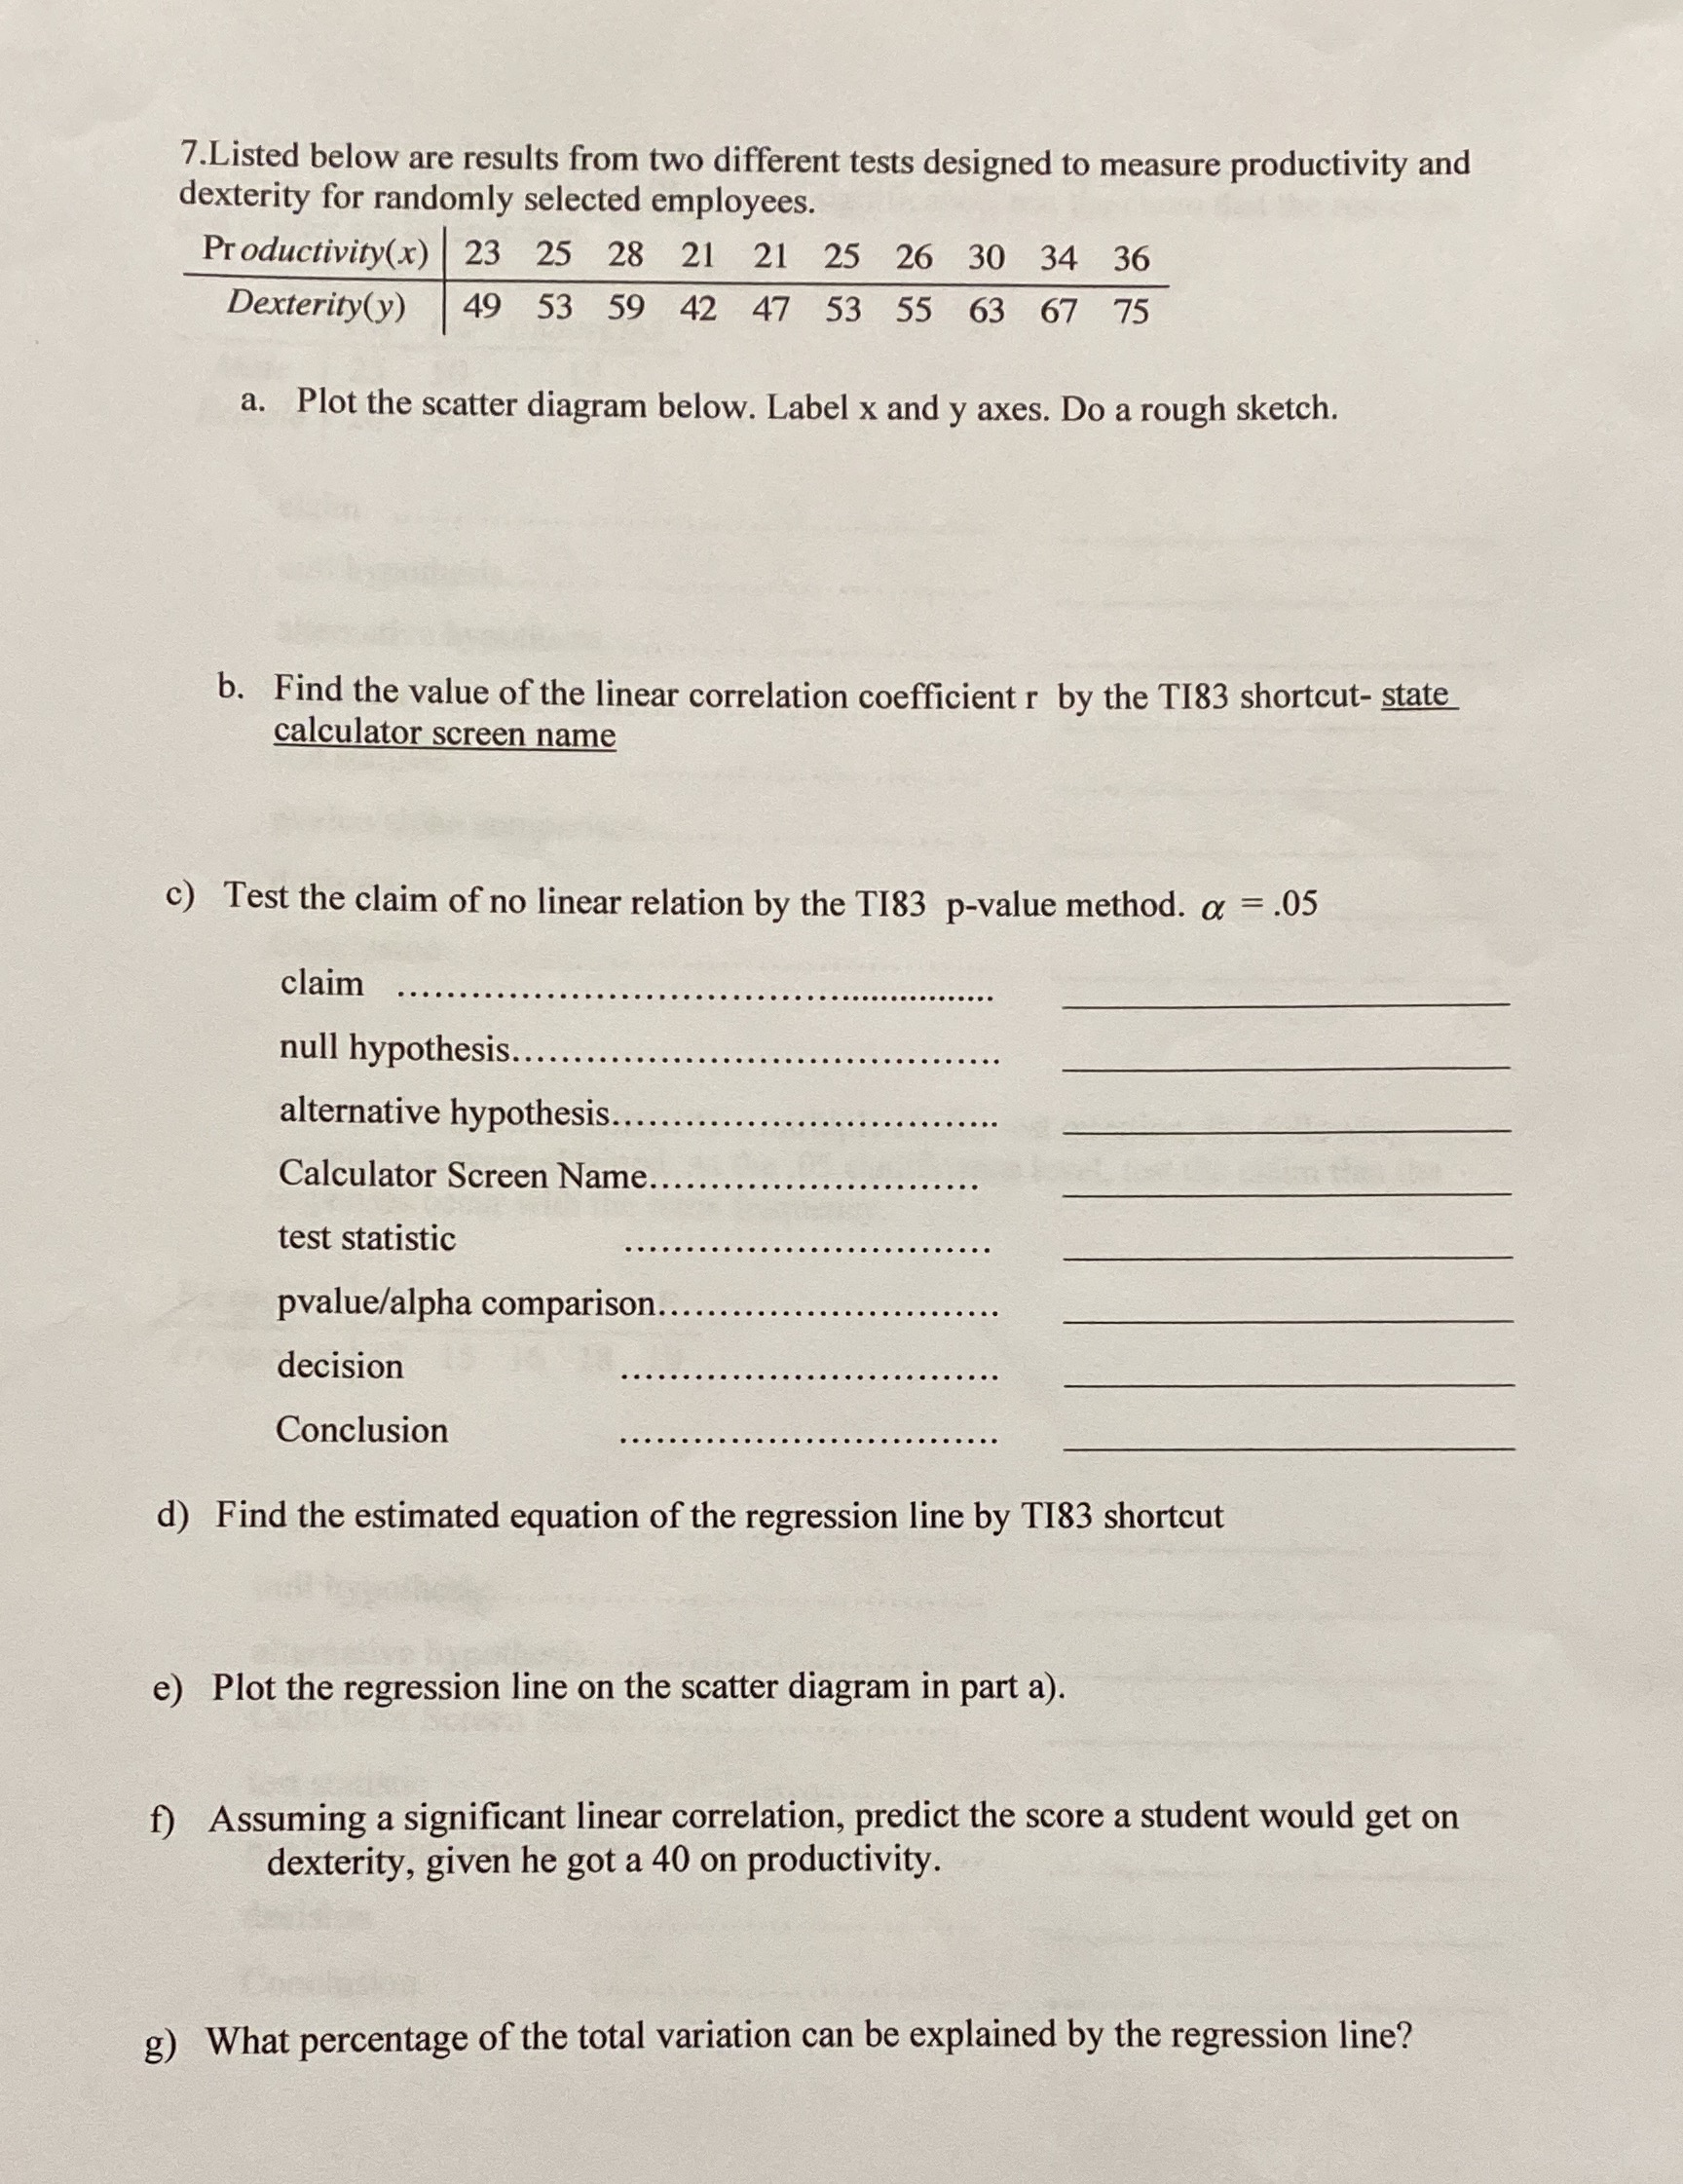
7.Listed below are results from two different tests designed to measure productivity and dexterity for randomly selected employees. Productivity(x) 23 25 28 21 21 25 26 30 34 36 Dexterity(y) 49 53 59 42 47 53 55 63 67 75 a. Plot the scatter diagram below. Label x and y axes. Do a rough sketch. b. Find the value of the linear correlation coefficient r by the TI83 shortcut- state calculator screen name c) Test the claim of no linear relation by the TI83 p-value method. a = .05 claim null hypothesis.... alternative hypothesis......... Calculator Screen Name......... test statistic pvalue/alpha comparison.. decision Conclusion d) Find the estimated equation of the regression line by T183 shortcut e) Plot the regression line on the scatter diagram in part a). f) Assuming a significant linear correlation, predict the score a student would get on dexterity, given he got a 40 on productivity. g) What percentage of the total variation can be explained by the regression line
Step by Step Solution
There are 3 Steps involved in it

Get step-by-step solutions from verified subject matter experts