

Question: 8 ( 1 4 ) The following data were collected as a candle burned. The data show how the height of the candle changed over
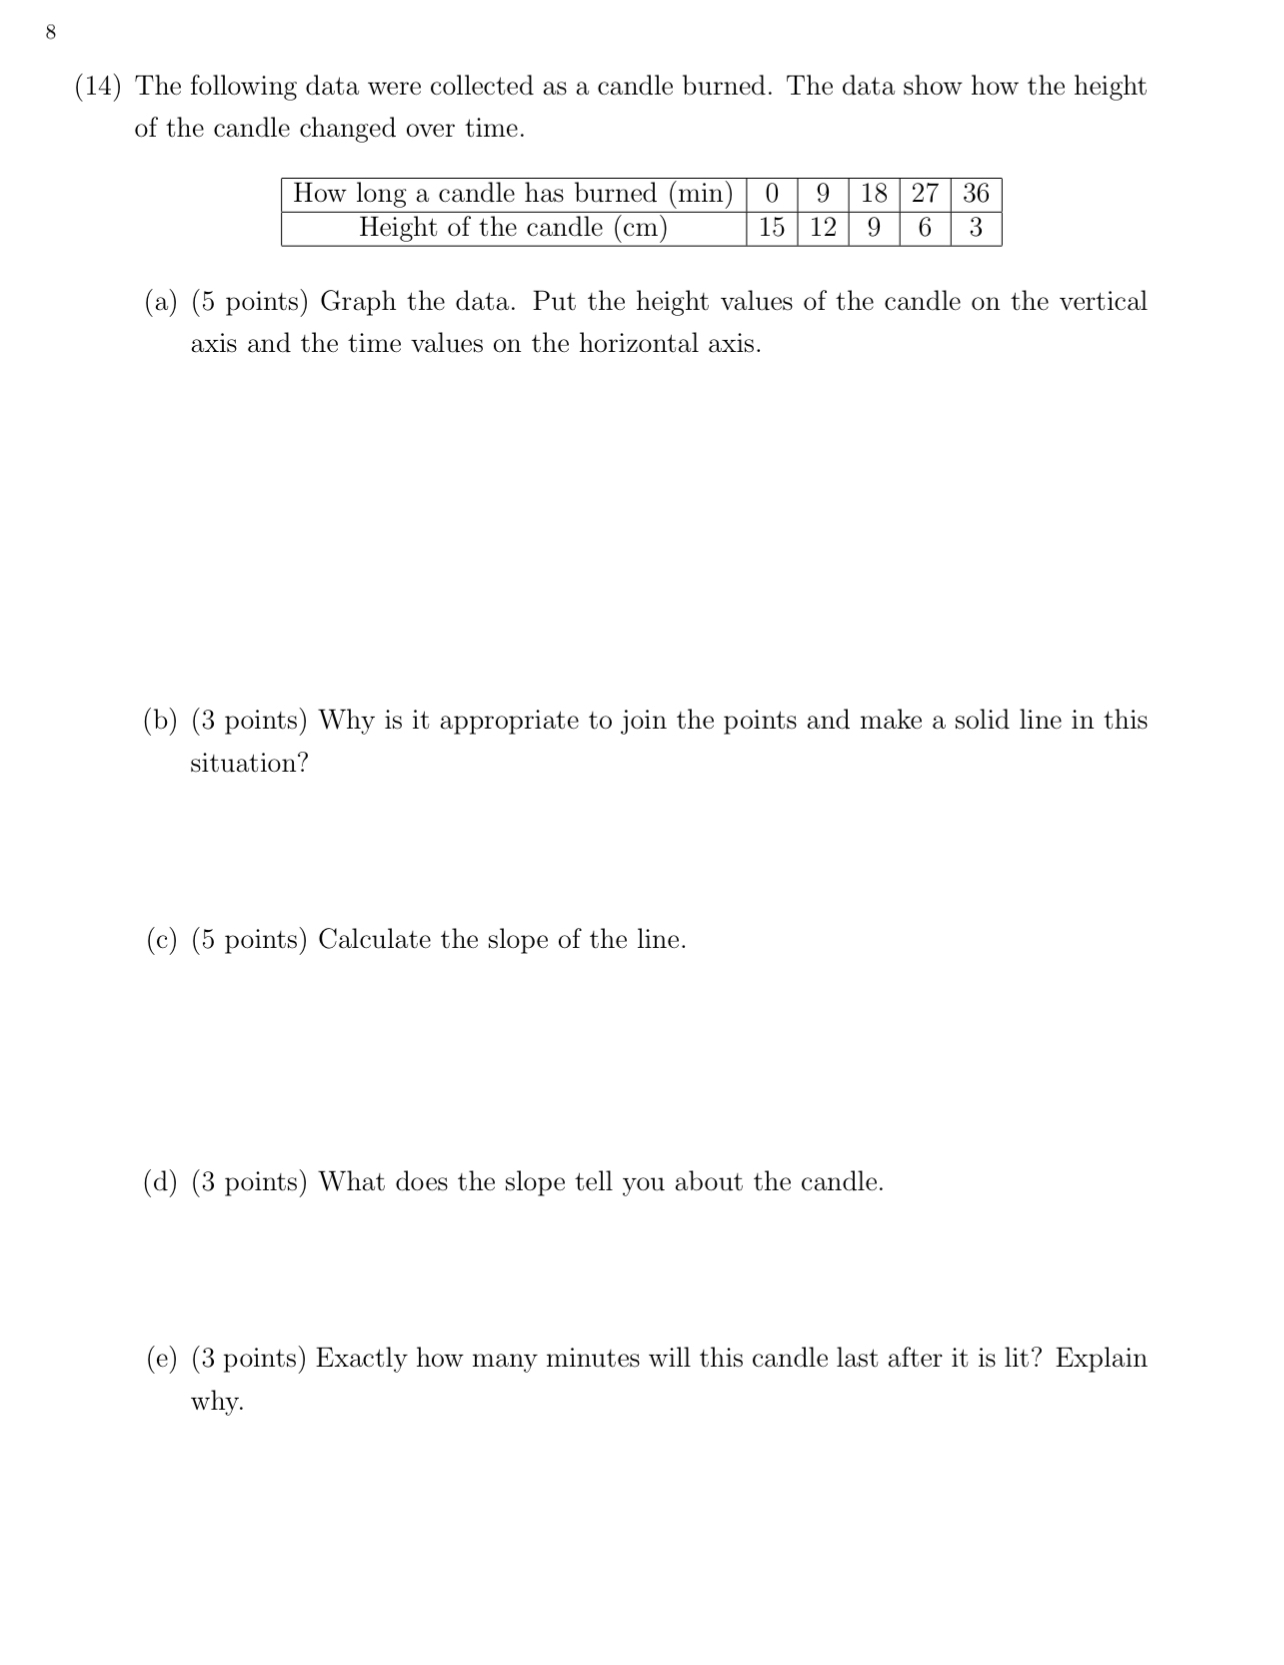
The following data were collected as a candle burned. The data show how the height of the candle changed over time.
tableHow long a candle has burned Height of the candle
a points Graph the data. Put the height values of the candle on the vertical axis and the time values on the horizontal axis.
b points Why is it appropriate to join the points and make a solid line in this situation?
c points Calculate the slope of the line.
d points What does the slope tell you about the candle.
e points Exactly how many minutes will this candle last after it is lit? Explain why.
Step by Step Solution
There are 3 Steps involved in it
1 Expert Approved Answer
Step: 1 Unlock

Question Has Been Solved by an Expert!
Get step-by-step solutions from verified subject matter experts
Step: 2 Unlock
Step: 3 Unlock