

Question: 8 1 point Use the data and table below to test the indicated claim about the means of two populations. Assume that the two samples
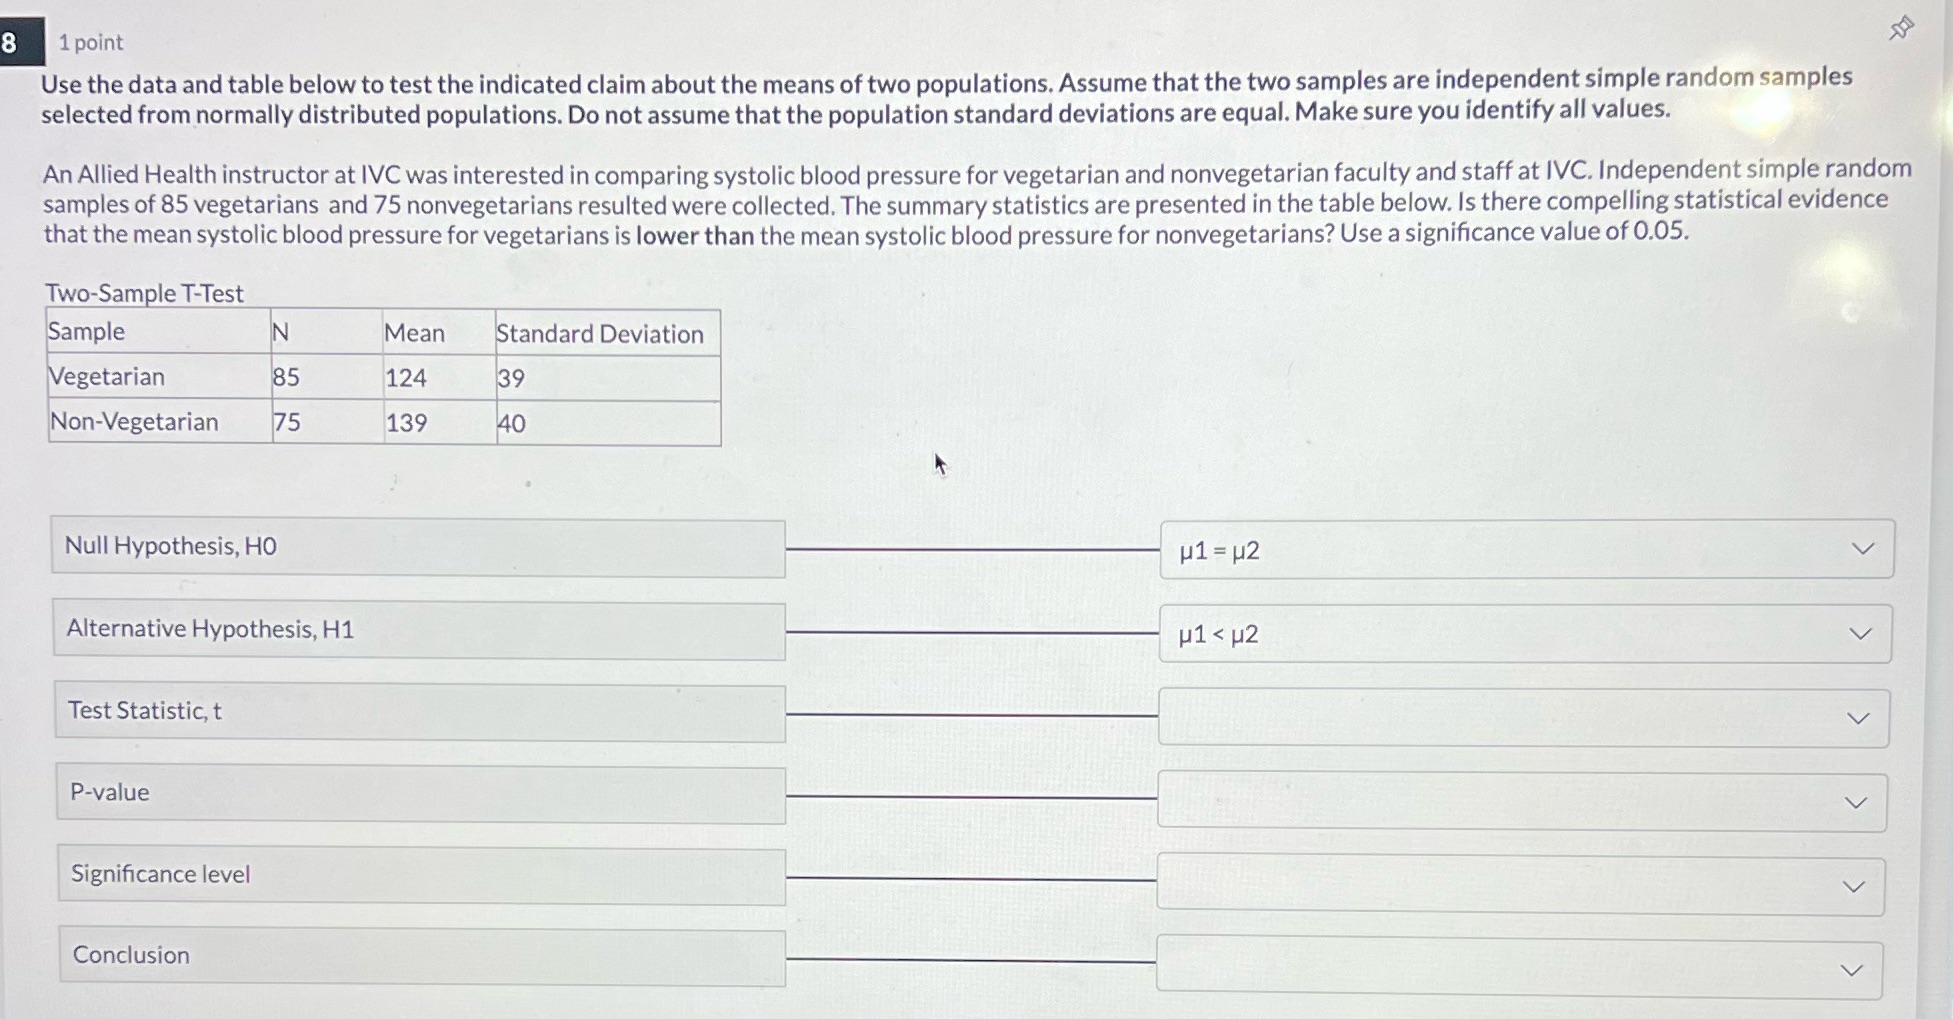
8 1 point Use the data and table below to test the indicated claim about the means of two populations. Assume that the two samples are independent simple random samples selected from normally distributed populations. Do not assume that the population standard deviations are equal. Make sure you identify all values. An Allied Health instructor at IVC was interested in comparing systolic blood pressure for vegetarian and nonvegetarian faculty and staff at IVC. Independent simple random samples of 85 vegetarians and 75 nonvegetarians resulted were collected. The summary statistics are presented in the table below. Is there compelling statistical evidence that the mean systolic blood pressure for vegetarians is lower than the mean systolic blood pressure for nonvegetarians? Use a significance value of 0.05. Two-Sample T-Test Sample N Mean Standard Deviation Vegetarian 85 124 39 Non-Vegetarian 75 139 40 Null Hypothesis, HO H1 = U2 Alternative Hypothesis, H1 H1
Step by Step Solution
There are 3 Steps involved in it

Get step-by-step solutions from verified subject matter experts