

Question: 8. (10 pts) A. Use Excel (or another graphing program) to draw the growth curve, In (X/X) vs time, for bacteria grown in a 20L
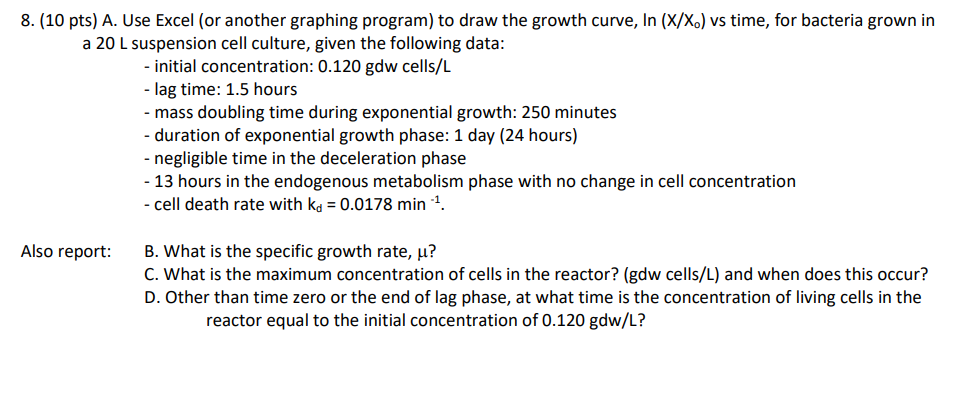
8. (10 pts) A. Use Excel (or another graphing program) to draw the growth curve, In (X/X) vs time, for bacteria grown in a 20L suspension cell culture, given the following data: - initial concentration: 0.120 gdw cells/L - lag time: 1.5 hours - mass doubling time during exponential growth: 250 minutes - duration of exponential growth phase: 1 day (24 hours) - negligible time in the deceleration phase - 13 hours in the endogenous metabolism phase with no change in cell concentration - cell death rate with kd=0.0178min1. Also report: B. What is the specific growth rate, ? C. What is the maximum concentration of cells in the reactor? (gdw cells/L) and when does this occur? D. Other than time zero or the end of lag phase, at what time is the concentration of living cells in the reactor equal to the initial concentration of 0.120gdw/L
Step by Step Solution
There are 3 Steps involved in it

Get step-by-step solutions from verified subject matter experts