

Question: 8 15 -80 -10 10 201 Estimating the Weighted Average Cost of Capital (WACC) for a project You currently own a company operating in the
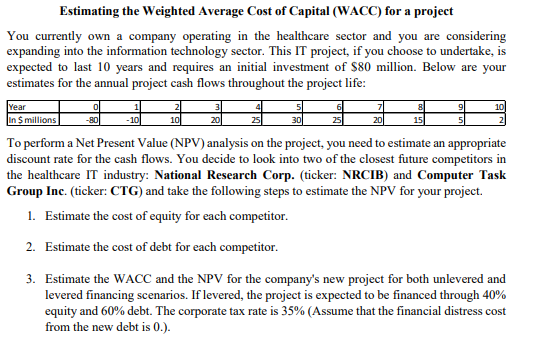
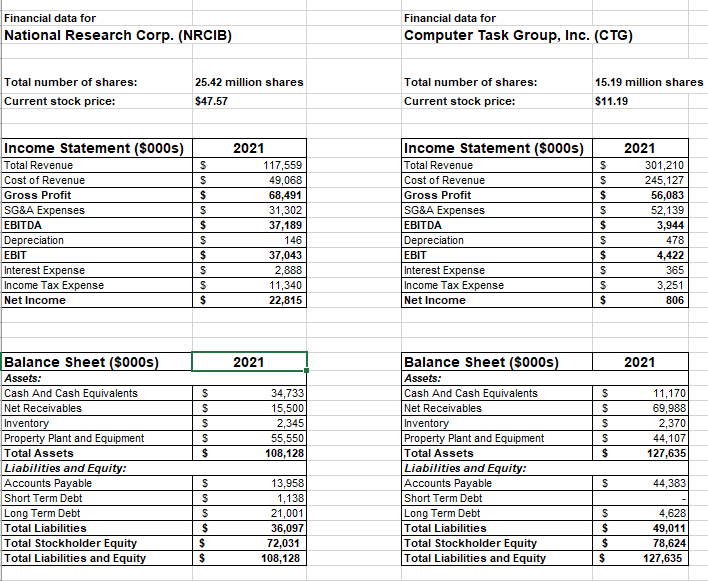
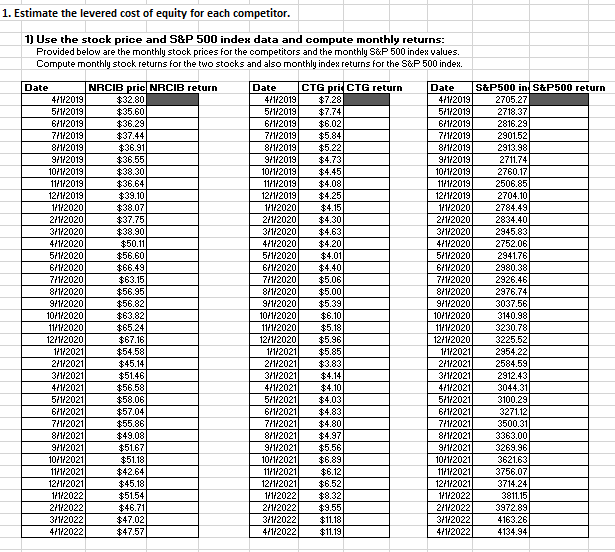
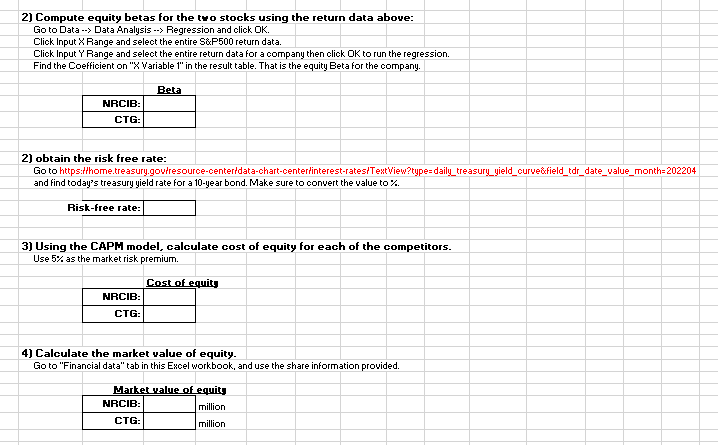
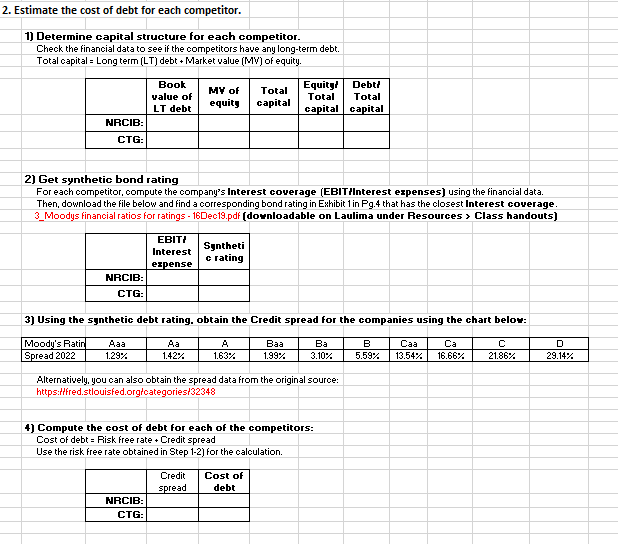
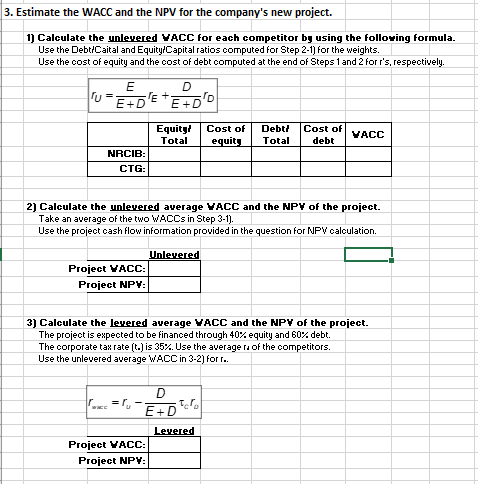
8 15 -80 -10 10 201 Estimating the Weighted Average Cost of Capital (WACC) for a project You currently own a company operating in the healthcare sector and you are considering expanding into the information technology sector. This IT project, if you choose to undertake, is expected to last 10 years and requires an initial investment of $80 million. Below are your estimates for the annual project cash flows throughout the project life: Year In 5 millions To perform a Net Present Value (NPV) analysis on the project, you need to estimate an appropriate discount rate for the cash flows. You decide to look into two of the closest future competitors in the healthcare IT industry: National Research Corp. (ticker: NRCIB) and Computer Task Group Inc. (ticker: CTG) and take the following steps to estimate the NPV for your project. 1. Estimate the cost of equity for each competitor. 2. Estimate the cost of debt for each competitor. 3. Estimate the WACC and the NPV for the company's new project for both unlevered and levered financing scenarios. If levered, the project is expected to be financed through 40% equity and 60% debt. The corporate tax rate is 35% (Assume that the financial distress cost from the new debt is 0.). Financial data for National Research Corp. (NRCIB) Financial data for Computer Task Group, Inc. (CTG) Total number of shares: Current stock price: 25.42 million shares $47.57 Total number of shares: Current stock price: 15.19 million shares $11.19 Income Statement ($000s) Total Revenue Cost of Revenue Gross Profit SG&A Expenses EBITDA Depreciation $ $ $ $ $ $ $ $ S $ 2021 117,559 49,068 68,491 31,302 37,189 146 37,043 2,888 11,340 22,815 Income Statement ($000s) Total Revenue Cost of Revenue Gross Profit SG&A Expenses EBITDA Depreciation EBIT Interest Expense Income Tax Expense Net Income S S $ $ $ $ $ S $ $ 2021 301,210 245,127 56,083 52,139 3,944 478 4,422 365 3,251 806 EBIT Interest Expense Income Tax Expense Net Income 2021 2021 $ $ $ $ $ 34,733 15,500 2,345 55,550 108,128 $ $ $ $ $ 11,1701 69,988 2,370 44,107 127,635 Balance Sheet($000s) Assets: Cash And Cash Equivalents Net Receivables Inventory Property Plant and Equipment Total Assets Liabilities and Equity: Accounts Payable Short Term Debt Long Term Debt Total Liabilities Total Stockholder Equity Total Liabilities and Equity Balance Sheet($000s) Assets: Cash And Cash Equivalents Net Receivables Inventory Property Plant and Equipment Total Assets Liabilities and Equity: Accounts Payable Short Term Debt Long Term Debt Total Liabilities Total Stockholder Equity Total Liabilities and Equity $ 44,383 S S $ $ $ $ 13,958 1,138 21,001 36,097 72,031 108,128 lul $ $ $ $ 4,628 49,011 78,624 127,635 1. Estimate the levered cost of equity for each competitor. 1) Use the stock price and S&P 500 index data and compute monthly returns: Provided below are the monthly stock prices for the competitors and the monthly S&P 500 index values. Compute monthly stock returns for the two stocks and also monthly index returns for the S&P 500 index. Date NRCIB pric NRCIB return 4/1/2019 $32.80 5/1/2019 $35.60 6/1/2019 $36.29 7/1/2019 $37.44 8/1/2019 $36.91 9/1/2019 $36.55 10/1/2019 $38.30 11/1/2019 $36.64 12/1/2019 $39.10 1/1/2020 $38.07 2/1/2020 $37.75 3/1/2020 $38.90 4/1/2020 $50.11 5/1/2020 $56.60 6/1/2020 $66.49 7/1/2020 $63.15 8/1/2020 $56.95 9/1/2020 $56.82 10/1/2020 $63.82 11/1/2020 $65.24 12/1/2020 $67.16 1/1/20211 $54.58 2/1/2021 $45.14 3/1/2021 $51.46 4/1/2021 $56.58 5/1/2021 $58.06 6/1/2021 $57.04 7/1/2021 $55.86 8/1/2021 $49.08 9/1/2021 $51.67 10/1/2021 $51.18 11/1/2021 $42.64 12/1/2021 $45.18 1/1/2022 $51.54 2/1/2022 $46.71 3/1/2022 $47.02 4/1/2022 $47.57 Date CTG pri CTG return 4/1/2019 $7.28 5/1/2019 $7.74 6/1/2019 $6.02 7/1/2019 $5.84 8/1/2019 $5.22 9/1/2019 $4.73 10/1/2019 $4.45 11/1/2019 $4.08 12/1/2019 $4.25 1/1/2020 $4.15 2/1/2020 $4.30 3/1/2020 $4.63 4/1/2020 $4.20 5/1/2020 $4.01 6/1/2020 $4.40 7/1/2020 $5.06 8/1/2020 $5.00 9/1/2020 $5.39 10/1/2020 $6.10 11/1/2020 $5.18 12/1/2020 $5.96 1/1/2021 $5.85 2/1/2021 $3.83 3/1/2021 $4.14 4/1/2021 $4.10 5/1/2021 $4.03 6/1/2021 $4.83 7/1/2021 $4.80 8/1/2021 $4.97 9/1/2021 $5.56 10/1/2021 $6.89 11/1/2021 $6.12 12/1/2021 $6.52 1/1/2022 $8.32 2/1/2022 $9.55 3/1/2022 $11.18 4/1/2022 $11.19 Date S&P500 in S&P500 return 4/1/2019 2705.27 5/1/2019 2718.37 6/1/2019 2816.29 7/1/2019 2901.52 8/1/2019 2913.98 9/1/2019 2711.74 10/1/2019 2760.17 11/1/2019 2506.85 12/1/2019 2704.10 1/1/2020 2784.49 2/1/2020 2834.40 3/1/2020 2945.83 4/1/2020 2752.06 5/1/2020 2941.76 6/1/2020 2980.38 7/1/2020 2926.46 8/1/2020 2976.74 9/1/2020 3037.56 10/1/2020 3140.98 11/1/2020 3230.78 12/1/2020 3225.52 1/1/2021 2954.22 2/1/2021 2584.59 3/1/2021 2912.43 4/1/2021 3044.31 5/1/2021 3100.29 6/1/2021 3271.12 7/1/2021 3500.31 8/1/2021 3363.00 9/1/2021 3269.96 10/1/2021 3621.63 11/1/2021 3756.07 12/1/2021 3714.24 1/1/2022 3811.15 2/1/2022 3972.89 3/1/2022 4163.26 4/1/2022 4134.94 2) Compute equity betas for the two stocks using the return data above: Go to Data --> Data Analysis -> Regression and click OK. Click Input X Range and select the entire S&P500 return data. Click Input Y Range and select the entire return data for a company then click OK to run the regression. Find the Coefficient on "X Variable 1" in the result table. That is the equity Beta for the company. Beta NRCIB: CTG: 2) obtain the risk free rate: Go to https://home.treasury.goviresource center'data-chart-center interest-rates/TextView?type=daily_treasury_yield_curve&field_tdr_date_value_month202204 and find today's treasury yield rate for a 10-year bond. Make sure to convert the value to %. Risk-free rate: 3) Using the CAPM model, calculate cost of equity for each of the competitors. Use 5% as the market risk premium. Cost of equity NRCIB: CTG: 4) Calculate the market value of equity. Go to "Financial data" tab in this Excel workbook, and use the share information provided. Market value of equity NRCIB: million CTG: million 2. Estimate the cost of debt for each competitor. 1) Determine capital structure for each competitor. Check the financial data to see if the competitors have any long-term debt. Total capital - Long term (LT) debt + Market value (MV) of equity. Book value of LT debt MY of equity Total capital Equity/ Debt: Total Total capital capital NRCIB: CTG: 2) Get synthetic bond rating For each competitor, compute the company's Interest coverage (EBIT/Interest expenses) using the financial data. Then, download the file below and find a corresponding bond rating in Exhibit 1 in Pg.4 that has the closest Interest coverage. 3_Moodys financial ratios for ratings - 16 Dec19.pdf (downloadable on Laulima under Resources > Class handouts) Syntheti c rating EBITI Interest expense NRCIB: CTG: 3) Using the synthetic debt rating. obtain the Credit spread for the companies using the chart below: Moody's Ratin Spread 2022 Aaa 1.29% Aa 1.42% Baa 1.99% Ba 3.10% B 5.59% Caa 13.54% Ca 16.66% C 21.86% D 29.14% 1.63% Alternatively, you can also obtain the spread data from the original source: https://fred.stlouisfed.org/categories/32348 4) Compute the cost of debt for each of the competitors: Cost of debt - Risk free rate. Credit spread Use the risk free rate obtained in Step 1-2) for the calculation. Credit spread Cost of debt NRCIB: CTG: 3. Estimate the WACC and the NPV for the company's new project. 1) Calculate the unlevered VACC for each competitor by using the following formula. Use the Debt/Caital and Equity/Capital ratios computed for Step 2-1) for the weights. Use the cost of equity and the cost of debt computed at the end of Steps 1 and 2 forr's, respectively. TU DE TEAD E E+ TE + + 50 Equity Total Cost of equity Debti Total Cost of debt VACC NRCIB: CTG: 2) Calculate the unlevered average VACC and the NPY of the project. Take an average of the two WACCs in Step 3-1). Use the project cash flow information provided in the question for NPV calculation. Unlevered Project VACC: Project NPY: 3) Calculate the levered average VACC and the NPY of the project. The project is expected to be financed through 40% equity and 60% debt. The corporate tax rate (t.) is 35%. Use the average ra of the competitors. Use the unlevered average WACC in 3-2) for r.. D r=1,- Levered Project VACC: Project NPY: 8 15 -80 -10 10 201 Estimating the Weighted Average Cost of Capital (WACC) for a project You currently own a company operating in the healthcare sector and you are considering expanding into the information technology sector. This IT project, if you choose to undertake, is expected to last 10 years and requires an initial investment of $80 million. Below are your estimates for the annual project cash flows throughout the project life: Year In 5 millions To perform a Net Present Value (NPV) analysis on the project, you need to estimate an appropriate discount rate for the cash flows. You decide to look into two of the closest future competitors in the healthcare IT industry: National Research Corp. (ticker: NRCIB) and Computer Task Group Inc. (ticker: CTG) and take the following steps to estimate the NPV for your project. 1. Estimate the cost of equity for each competitor. 2. Estimate the cost of debt for each competitor. 3. Estimate the WACC and the NPV for the company's new project for both unlevered and levered financing scenarios. If levered, the project is expected to be financed through 40% equity and 60% debt. The corporate tax rate is 35% (Assume that the financial distress cost from the new debt is 0.). Financial data for National Research Corp. (NRCIB) Financial data for Computer Task Group, Inc. (CTG) Total number of shares: Current stock price: 25.42 million shares $47.57 Total number of shares: Current stock price: 15.19 million shares $11.19 Income Statement ($000s) Total Revenue Cost of Revenue Gross Profit SG&A Expenses EBITDA Depreciation $ $ $ $ $ $ $ $ S $ 2021 117,559 49,068 68,491 31,302 37,189 146 37,043 2,888 11,340 22,815 Income Statement ($000s) Total Revenue Cost of Revenue Gross Profit SG&A Expenses EBITDA Depreciation EBIT Interest Expense Income Tax Expense Net Income S S $ $ $ $ $ S $ $ 2021 301,210 245,127 56,083 52,139 3,944 478 4,422 365 3,251 806 EBIT Interest Expense Income Tax Expense Net Income 2021 2021 $ $ $ $ $ 34,733 15,500 2,345 55,550 108,128 $ $ $ $ $ 11,1701 69,988 2,370 44,107 127,635 Balance Sheet($000s) Assets: Cash And Cash Equivalents Net Receivables Inventory Property Plant and Equipment Total Assets Liabilities and Equity: Accounts Payable Short Term Debt Long Term Debt Total Liabilities Total Stockholder Equity Total Liabilities and Equity Balance Sheet($000s) Assets: Cash And Cash Equivalents Net Receivables Inventory Property Plant and Equipment Total Assets Liabilities and Equity: Accounts Payable Short Term Debt Long Term Debt Total Liabilities Total Stockholder Equity Total Liabilities and Equity $ 44,383 S S $ $ $ $ 13,958 1,138 21,001 36,097 72,031 108,128 lul $ $ $ $ 4,628 49,011 78,624 127,635 1. Estimate the levered cost of equity for each competitor. 1) Use the stock price and S&P 500 index data and compute monthly returns: Provided below are the monthly stock prices for the competitors and the monthly S&P 500 index values. Compute monthly stock returns for the two stocks and also monthly index returns for the S&P 500 index. Date NRCIB pric NRCIB return 4/1/2019 $32.80 5/1/2019 $35.60 6/1/2019 $36.29 7/1/2019 $37.44 8/1/2019 $36.91 9/1/2019 $36.55 10/1/2019 $38.30 11/1/2019 $36.64 12/1/2019 $39.10 1/1/2020 $38.07 2/1/2020 $37.75 3/1/2020 $38.90 4/1/2020 $50.11 5/1/2020 $56.60 6/1/2020 $66.49 7/1/2020 $63.15 8/1/2020 $56.95 9/1/2020 $56.82 10/1/2020 $63.82 11/1/2020 $65.24 12/1/2020 $67.16 1/1/20211 $54.58 2/1/2021 $45.14 3/1/2021 $51.46 4/1/2021 $56.58 5/1/2021 $58.06 6/1/2021 $57.04 7/1/2021 $55.86 8/1/2021 $49.08 9/1/2021 $51.67 10/1/2021 $51.18 11/1/2021 $42.64 12/1/2021 $45.18 1/1/2022 $51.54 2/1/2022 $46.71 3/1/2022 $47.02 4/1/2022 $47.57 Date CTG pri CTG return 4/1/2019 $7.28 5/1/2019 $7.74 6/1/2019 $6.02 7/1/2019 $5.84 8/1/2019 $5.22 9/1/2019 $4.73 10/1/2019 $4.45 11/1/2019 $4.08 12/1/2019 $4.25 1/1/2020 $4.15 2/1/2020 $4.30 3/1/2020 $4.63 4/1/2020 $4.20 5/1/2020 $4.01 6/1/2020 $4.40 7/1/2020 $5.06 8/1/2020 $5.00 9/1/2020 $5.39 10/1/2020 $6.10 11/1/2020 $5.18 12/1/2020 $5.96 1/1/2021 $5.85 2/1/2021 $3.83 3/1/2021 $4.14 4/1/2021 $4.10 5/1/2021 $4.03 6/1/2021 $4.83 7/1/2021 $4.80 8/1/2021 $4.97 9/1/2021 $5.56 10/1/2021 $6.89 11/1/2021 $6.12 12/1/2021 $6.52 1/1/2022 $8.32 2/1/2022 $9.55 3/1/2022 $11.18 4/1/2022 $11.19 Date S&P500 in S&P500 return 4/1/2019 2705.27 5/1/2019 2718.37 6/1/2019 2816.29 7/1/2019 2901.52 8/1/2019 2913.98 9/1/2019 2711.74 10/1/2019 2760.17 11/1/2019 2506.85 12/1/2019 2704.10 1/1/2020 2784.49 2/1/2020 2834.40 3/1/2020 2945.83 4/1/2020 2752.06 5/1/2020 2941.76 6/1/2020 2980.38 7/1/2020 2926.46 8/1/2020 2976.74 9/1/2020 3037.56 10/1/2020 3140.98 11/1/2020 3230.78 12/1/2020 3225.52 1/1/2021 2954.22 2/1/2021 2584.59 3/1/2021 2912.43 4/1/2021 3044.31 5/1/2021 3100.29 6/1/2021 3271.12 7/1/2021 3500.31 8/1/2021 3363.00 9/1/2021 3269.96 10/1/2021 3621.63 11/1/2021 3756.07 12/1/2021 3714.24 1/1/2022 3811.15 2/1/2022 3972.89 3/1/2022 4163.26 4/1/2022 4134.94 2) Compute equity betas for the two stocks using the return data above: Go to Data --> Data Analysis -> Regression and click OK. Click Input X Range and select the entire S&P500 return data. Click Input Y Range and select the entire return data for a company then click OK to run the regression. Find the Coefficient on "X Variable 1" in the result table. That is the equity Beta for the company. Beta NRCIB: CTG: 2) obtain the risk free rate: Go to https://home.treasury.goviresource center'data-chart-center interest-rates/TextView?type=daily_treasury_yield_curve&field_tdr_date_value_month202204 and find today's treasury yield rate for a 10-year bond. Make sure to convert the value to %. Risk-free rate: 3) Using the CAPM model, calculate cost of equity for each of the competitors. Use 5% as the market risk premium. Cost of equity NRCIB: CTG: 4) Calculate the market value of equity. Go to "Financial data" tab in this Excel workbook, and use the share information provided. Market value of equity NRCIB: million CTG: million 2. Estimate the cost of debt for each competitor. 1) Determine capital structure for each competitor. Check the financial data to see if the competitors have any long-term debt. Total capital - Long term (LT) debt + Market value (MV) of equity. Book value of LT debt MY of equity Total capital Equity/ Debt: Total Total capital capital NRCIB: CTG: 2) Get synthetic bond rating For each competitor, compute the company's Interest coverage (EBIT/Interest expenses) using the financial data. Then, download the file below and find a corresponding bond rating in Exhibit 1 in Pg.4 that has the closest Interest coverage. 3_Moodys financial ratios for ratings - 16 Dec19.pdf (downloadable on Laulima under Resources > Class handouts) Syntheti c rating EBITI Interest expense NRCIB: CTG: 3) Using the synthetic debt rating. obtain the Credit spread for the companies using the chart below: Moody's Ratin Spread 2022 Aaa 1.29% Aa 1.42% Baa 1.99% Ba 3.10% B 5.59% Caa 13.54% Ca 16.66% C 21.86% D 29.14% 1.63% Alternatively, you can also obtain the spread data from the original source: https://fred.stlouisfed.org/categories/32348 4) Compute the cost of debt for each of the competitors: Cost of debt - Risk free rate. Credit spread Use the risk free rate obtained in Step 1-2) for the calculation. Credit spread Cost of debt NRCIB: CTG: 3. Estimate the WACC and the NPV for the company's new project. 1) Calculate the unlevered VACC for each competitor by using the following formula. Use the Debt/Caital and Equity/Capital ratios computed for Step 2-1) for the weights. Use the cost of equity and the cost of debt computed at the end of Steps 1 and 2 forr's, respectively. TU DE TEAD E E+ TE + + 50 Equity Total Cost of equity Debti Total Cost of debt VACC NRCIB: CTG: 2) Calculate the unlevered average VACC and the NPY of the project. Take an average of the two WACCs in Step 3-1). Use the project cash flow information provided in the question for NPV calculation. Unlevered Project VACC: Project NPY: 3) Calculate the levered average VACC and the NPY of the project. The project is expected to be financed through 40% equity and 60% debt. The corporate tax rate (t.) is 35%. Use the average ra of the competitors. Use the unlevered average WACC in 3-2) for r.. D r=1,- Levered Project VACC: Project NPY
Step by Step Solution
There are 3 Steps involved in it

Get step-by-step solutions from verified subject matter experts