

Question: 8. (20 points) Create a bokeh Scatter plot as following: - Saperate Benign and Malignant data - x axis: area_mean - y axis: texture_mean -
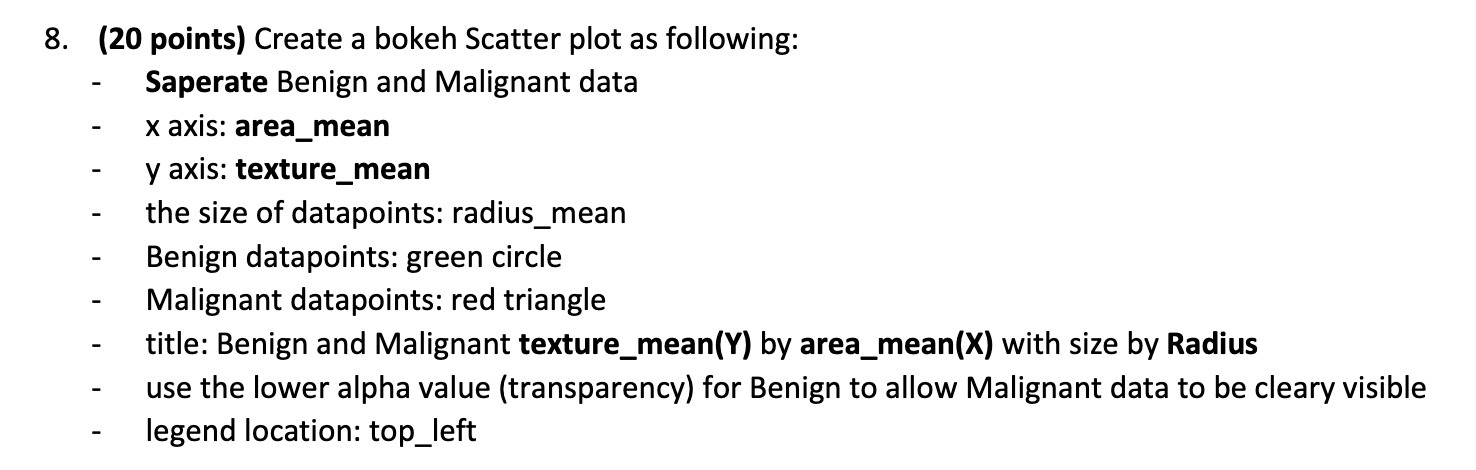
8. (20 points) Create a bokeh Scatter plot as following: - Saperate Benign and Malignant data - x axis: area_mean - y axis: texture_mean - the size of datapoints: radius_mean - Benign datapoints: green circle - Malignant datapoints: red triangle - title: Benign and Malignant texture_mean(Y) by area_mean(X) with size by Radius - use the lower alpha value (transparency) for Benign to allow Malignant data to be cleary visible - legend location: top_left
Step by Step Solution
There are 3 Steps involved in it
1 Expert Approved Answer
Step: 1 Unlock

Question Has Been Solved by an Expert!
Get step-by-step solutions from verified subject matter experts
Step: 2 Unlock
Step: 3 Unlock