

Question: 8 . 9 A cost - volume - profit ( CVP ) graph ( Figure P 8 . 9 ) is a useful technique for
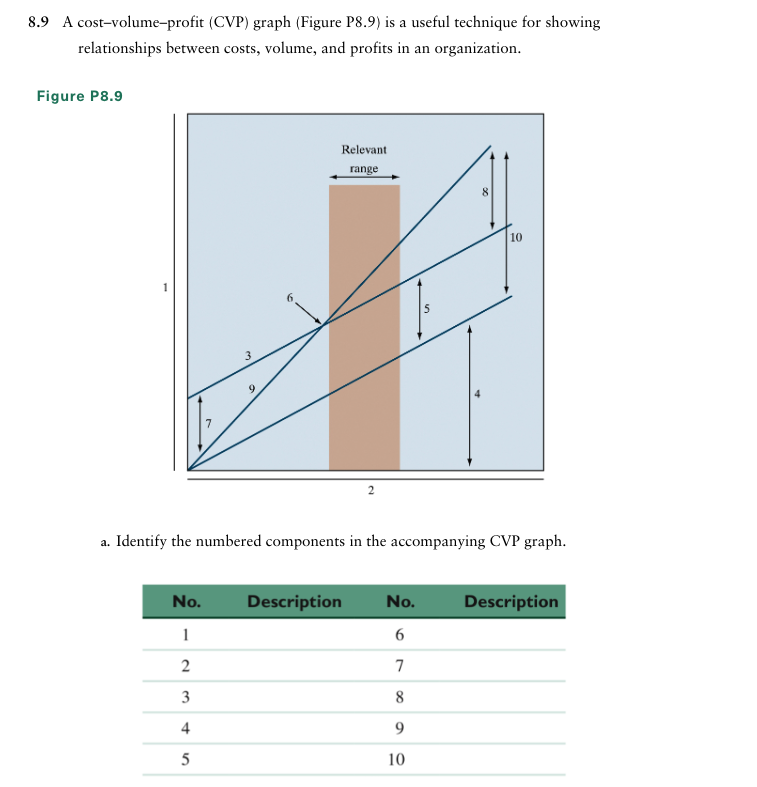
A costvolumeprofit CVP graph Figure P is a useful technique for showing relationships between costs, volume, and profits in an organization.
Figure P
a Identify the numbered components in the accompanying CVP graph.
tableNoDescription,NoDescription
Step by Step Solution
There are 3 Steps involved in it
1 Expert Approved Answer
Step: 1 Unlock

Question Has Been Solved by an Expert!
Get step-by-step solutions from verified subject matter experts
Step: 2 Unlock
Step: 3 Unlock