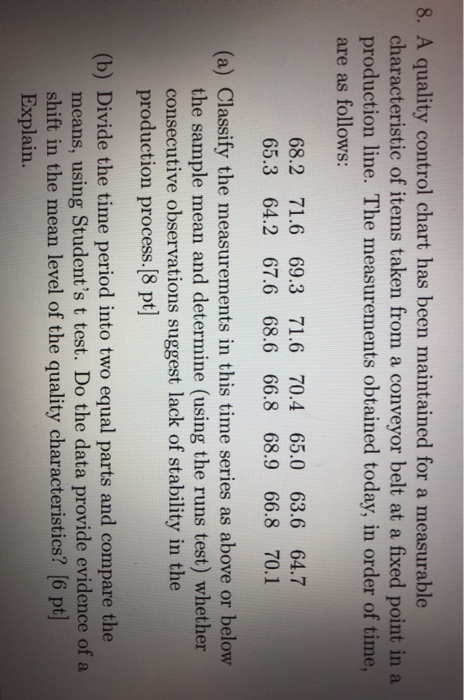
Question: 8. A quality control chart has been maintained for a measurable characteristic of items taken from a conveyor belt at a fixed point in a

8. A quality control chart has been maintained
8. A quality control chart has been maintained for a measurable characteristic of items taken from a conveyor belt at a fixed point in a production line. The measurements obtained today, in order of time, are as follows: 68.2 71.6 69.3 71.6 70.4 65.0 63.6 64.7 65.3 64.2 67.6 68.6 66.8 68.9 66.8 70.1 (a) Classify the measurements in this time series as above or below the sample mean and determine (using the runs test) whether consecutive observations suggest lack of stability in the production process.[8 pt] (b) Divide the time period into two equal parts and compare the means, using Student's t test. Do the data provide evidence of a shift in the mean level of the quality characteristics? (6 pt] Explain. 5. The following 50 observations were believed to be a random sample from the discrete probability distribution defined by P(X = r) = (1 - 1)p?(1 p)p-2 r = 2,3,... r 2 3 4 5 26 Frequency 18 18 17 12 3 0 An appropriate estimate of p is , where is the sample mean. Use a X2 test, at the 5% significance level, to investigate whether these data are consistent with the postulated distribution. (12 pt]

Step by Step Solution

There are 3 Steps involved in it

1 Expert Approved Answer
Step: 1 Unlock blur-text-image
Question Has Been Solved by an Expert!

Get step-by-step solutions from verified subject matter experts

Step: 2 Unlock
Step: 3 Unlock

Students Have Also Explored These Related General Management Questions!