

Question: 8 Assignment Saved Help Save & Exit Submit Exercise 18-35 (Algo) (LO18-3, LO18-5, LO18-7) The following data report total, monthly U.S. book-store sales in
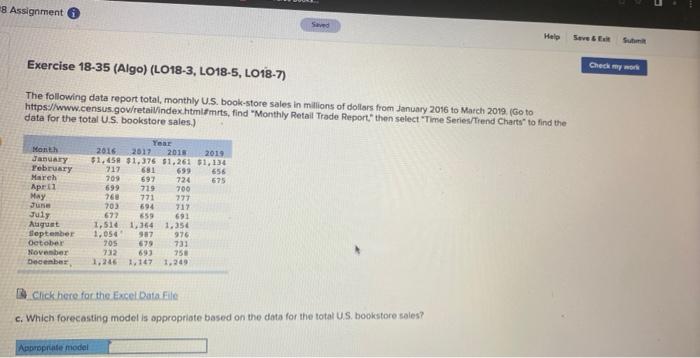
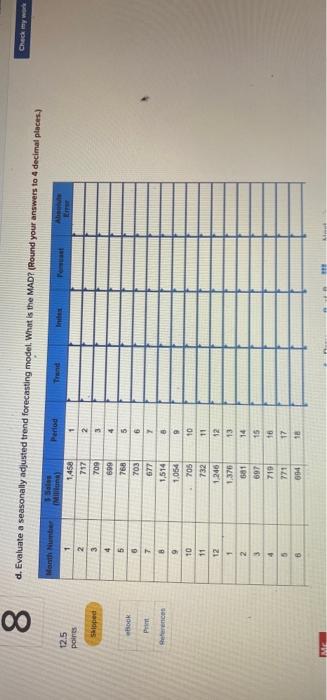
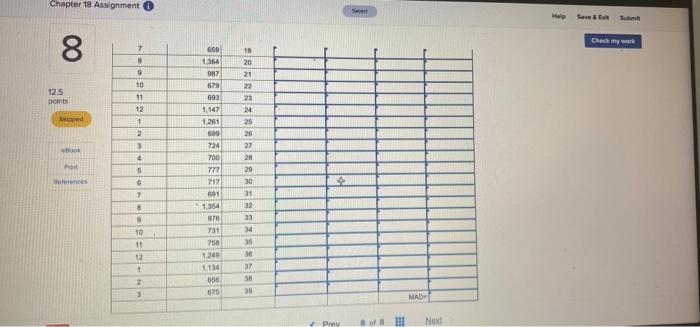
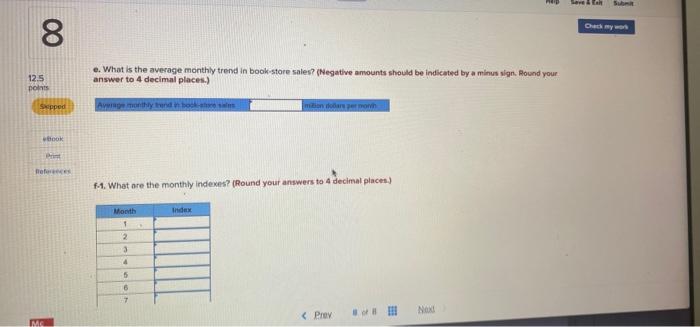

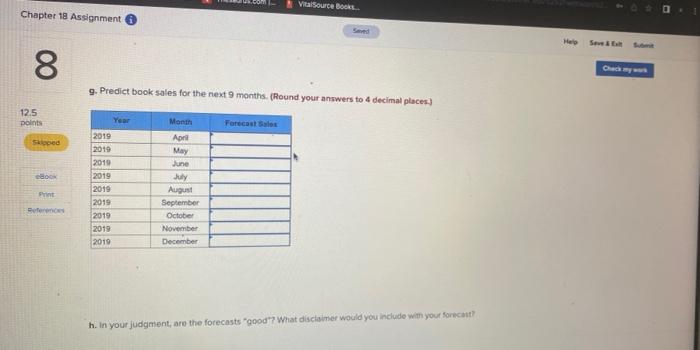
8 Assignment Saved Help Save & Exit Submit Exercise 18-35 (Algo) (LO18-3, LO18-5, LO18-7) The following data report total, monthly U.S. book-store sales in millions of dollars from January 2016 to March 2019. (Go to https://www.census.gov/retail/index.html#mrts, find "Monthly Retail Trade Report," then select "Time Series/Trend Charts" to find the data for the total US. bookstore sales.) Year Month January 2016 2017 2018 2019 $1,458 $1,376 $1,261 $1,134 February 717 681 699 656 March 709 697 724 675 April 699 719 700 May 768 771 777 June 703 694 717 July 677 659 691 August 1,514 1,364 1,354 September 1,054 987 976 October 205 679 731 November 732 693 258 December, 1,246 1,147 1,249) Click here for the Excel Data File c. Which forecasting model is appropriate based on the data for the total U.S. bookstore sales? Appropriate model Check my work
Step by Step Solution
There are 3 Steps involved in it

Get step-by-step solutions from verified subject matter experts