

Question: 8. Attach all your data analyses in an Excel file, which includes: 8.1. I spreadsheet with the raw data of the four variables in your
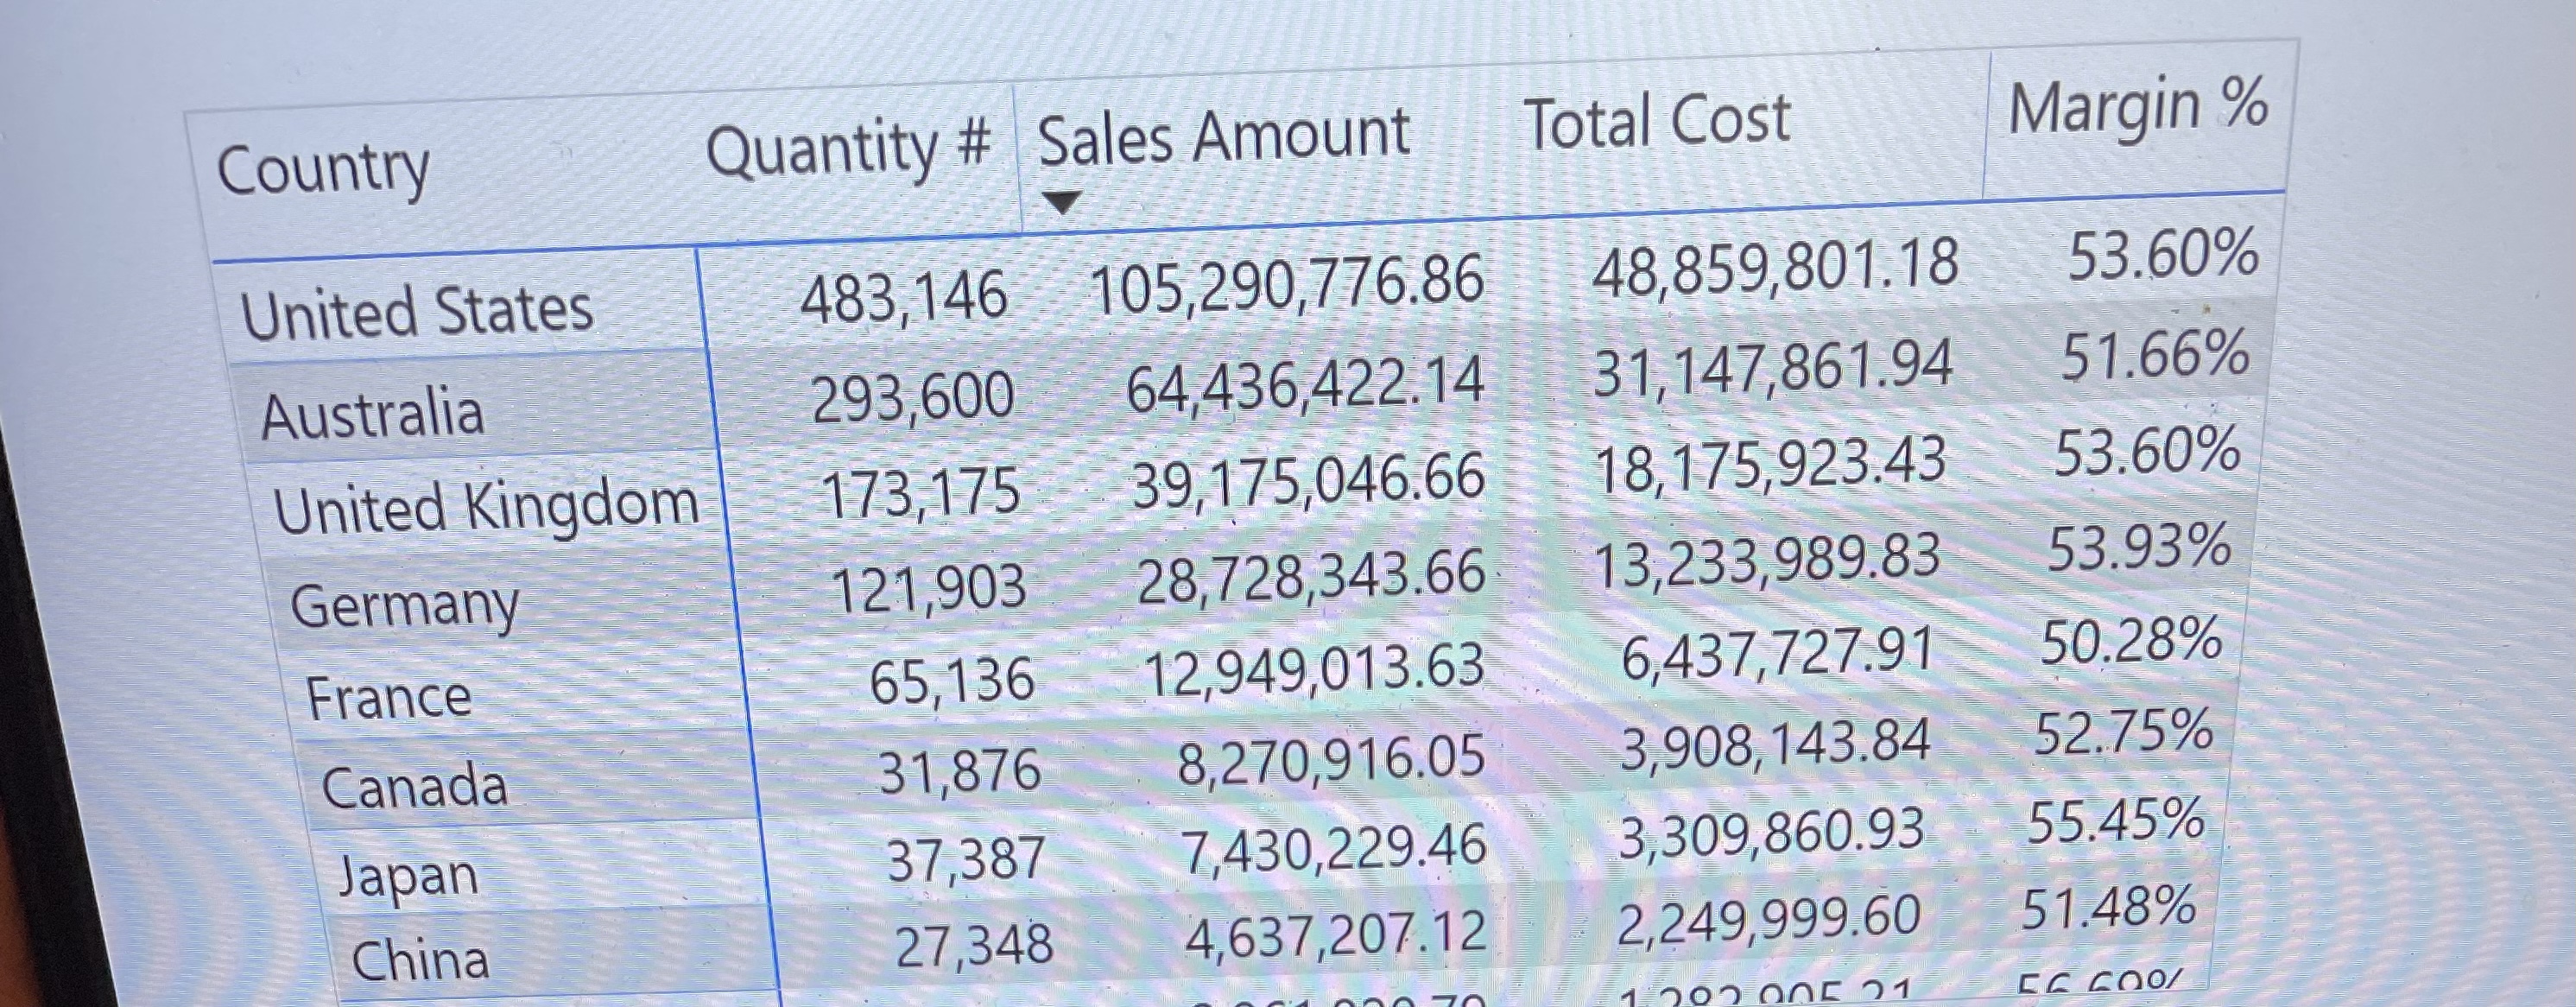
8. Attach all your data analyses in an Excel file, which includes: 8.1. I spreadsheet with the raw data of the four variables in your dataset 8.2. 1 spreadsheet with all five descriptive statistics for each of the four variables 8.3. 1 spreadsheet with the visualization of each of the four variables 8.4. . 1 spreadsheet with the hypothesis test 8.5. 1 spreadsheet with the linear and multiple regression analysesCountry Quantity # Sales Amount Total Cost Margin % United States 483,146 105,290,776.86 48,859,801.18 53.60% Australia 293,600 64,436,422.14 31,147,861.94 51.66% United Kingdom 173,175 39,175,046.66 18,175,923.43 53.60% Germany 121,903 28,728,343.66 13,233,989.83 53.93% France 65, 136 12,949,013.63 6,437,727.91 50.28% Canada 31,876 8,270,916.05 3,908, 143.84 52.75% Japan 37,387 7,430,229.46 3,309,860.93 55.45% China 27,348 4,637,207.12 2,249,999.60 51.48% CC COOL
Step by Step Solution
There are 3 Steps involved in it

Get step-by-step solutions from verified subject matter experts