

Question: 8 Based on Figure 3, what is the allowable range of the objective coefficient for item B for which the current solution remains optimal? 9
8 Based on Figure 3, what is the allowable range of the objective coefficient for item B for which the current solution remains optimal?
9 Based on Figure 3, what will be the extra profit if the quantity of the resource represented by constraint 2 is increased by 10000?
10 Based on Figure 3, if resource 2 (i.e. right hand side of constraint 2) is increased by 6000 units, what will be the delta amount impact on the profit?
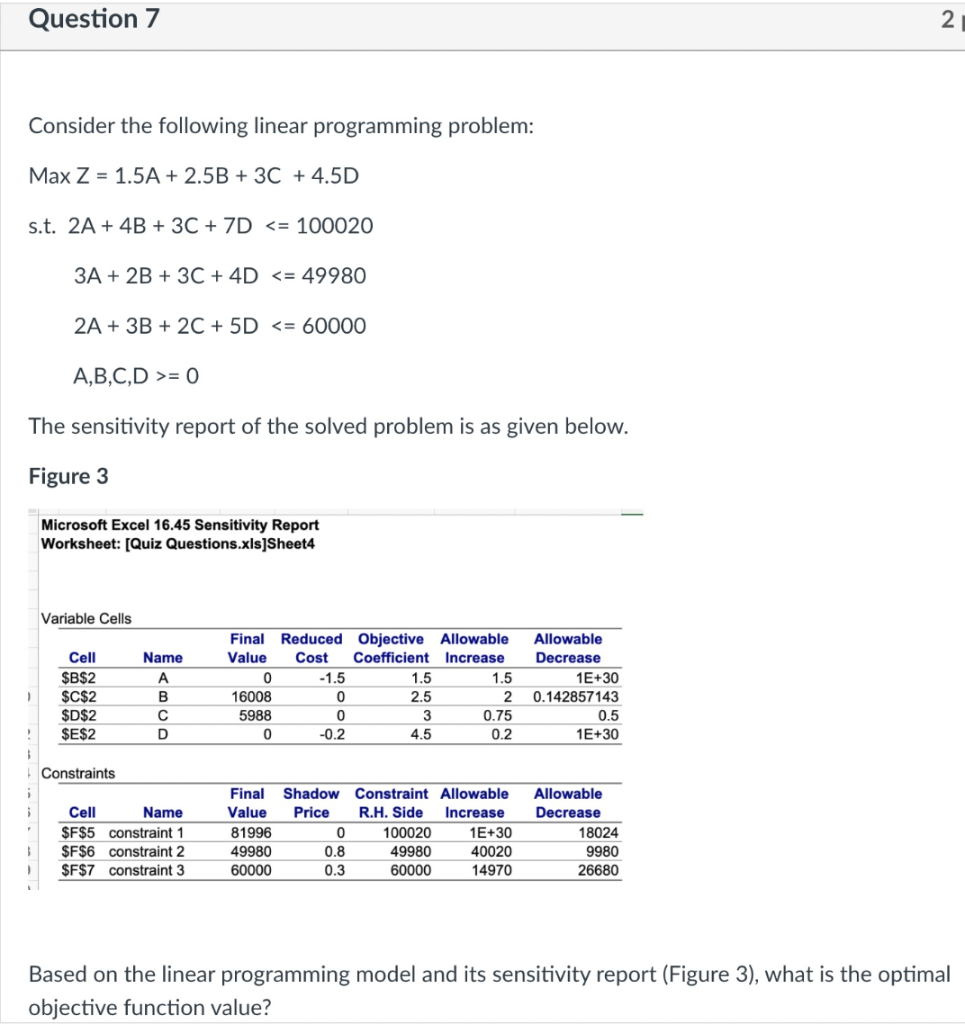
Question 7 2 Consider the following linear programming problem: Max Z = 1.5A + 2.5B + 3C + 4.5D s.t. 2A + 4B + 3C + 7D = 0 The sensitivity report of the solved problem is as given below. Figure 3 Microsoft Excel 16.45 Sensitivity Report Worksheet: [Quiz Questions.xls]Sheet4 Variable Cells Name Cell $B$2 $C$2 $D$2 $E$2 A B Final Reduced Objective Allowable Value Cost Coefficient Increase 0 -1.5 1.5 1.5 16008 0 2.5 2 5988 0 3 0.75 0 -0.2 4.5 0.2 Allowable Decrease 1E+30 0.142857143 0.5 1E+30 1 C D Constraints Cell Name $F$5 constraint 1 $F$6 constraint 2 $F$7 constraint 3 Final Value 81996 49980 60000 Shadow Constraint Allowable Price R.H. Side Increase 0 100020 1E+30 0.8 49980 40020 0.3 60000 14970 Allowable Decrease 18024 9980 26680 3 ) Based on the linear programming model and its sensitivity report (Figure 3), what is the optimal objective function valueStep by Step Solution
There are 3 Steps involved in it
1 Expert Approved Answer
Step: 1 Unlock

Question Has Been Solved by an Expert!
Get step-by-step solutions from verified subject matter experts
Step: 2 Unlock
Step: 3 Unlock