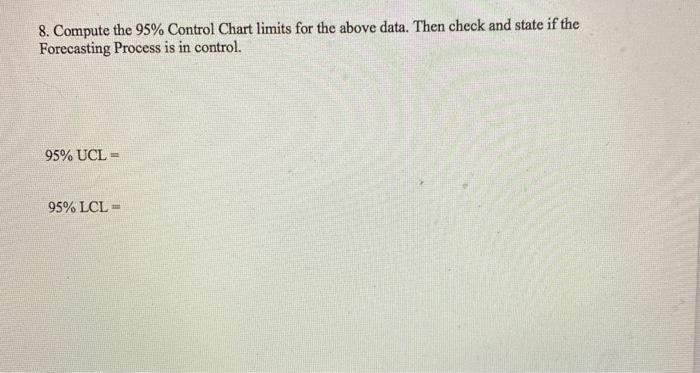
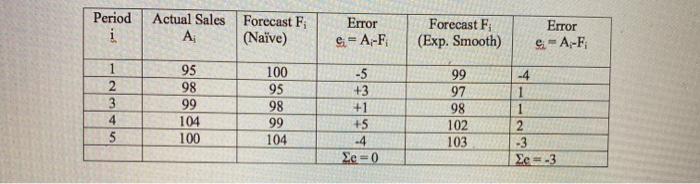
Question: 8. Compute the 95% Control Chart limits for the above data. Then check and state if the Forecasting Process is in control. 95% UCL 95%

8. Compute the 95% Control Chart limits for the
8. Compute the 95% Control Chart limits for the above data. Then check and state if the Forecasting Process is in control. 95% UCL 95% LCL i Period Actual Sales A Error i Forecast F; (Naive) e=A-F Forecast F; (Exp. Smooth) Error e A-F; 1 2 3 4 5 95 98 99 104 100 100 95 98 99 104 -5 +3 +1 +5 .4 Xe = 0 99 97 98 102 103 -4 1 1 2 -3 X=-3

Step by Step Solution

There are 3 Steps involved in it

1 Expert Approved Answer
Step: 1 Unlock blur-text-image
Question Has Been Solved by an Expert!

Get step-by-step solutions from verified subject matter experts

Step: 2 Unlock
Step: 3 Unlock

Students Have Also Explored These Related General Management Questions!