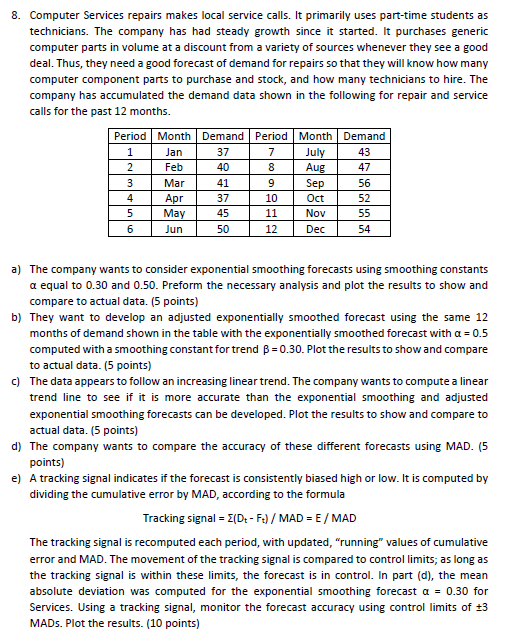
Question: 8. Computer Services repairs makes local service calls. It primarily uses part-time students as technicians. The company has had steady growth since it started. It

8. Computer Services repairs makes local service

8. Computer Services repairs makes local service calls. It primarily uses part-time students as technicians. The company has had steady growth since it started. It purchases generic computer parts in volume at a discount from a variety of sources whenever they see a good deal. Thus, they need a good forecast of demand for repairs so that they will know how many computer component parts to purchase and stock, and how many technicians to hire. The company has accumulated the demand data shown in the following for repair and service calls for the past 12 months. Period Month Demand Period Month Demand 1 Jan 37 July Feb 40 47 Mar Apr Oct May Nov Jun Dec 43 NA 7 8 2 3 Aug Sep 4 41 37 45 50 9 10 11 12 56 52 55 54 5 6 a) The company wants to consider exponential smoothing forecasts using smoothing constants a equal to 0.30 and 0.50. Preform the necessary analysis and plot the results to show and compare to actual data. (5 points) b) They want to develop an adjusted exponentially smoothed forecast using the same 12 months of demand shown in the table with the exponentially smoothed forecast with a = 0.5 computed with a smoothing constant for trend B = 0.30. Plot the results to show and compare to actual data. (5 points) c) The data appears to follow an increasing linear trend. The company wants to compute a linear trend line to see if it is more accurate than the exponential smoothing and adjusted exponential smoothing forecasts can be developed. Plot the results to show and compare to actual data. (5 points) d) The company wants to compare the accuracy of these different forecasts using MAD. (5 points) e) A tracking signal indicates if the forecast is consistently biased high or low. It is computed by dividing the cumulative error by MAD, according to the formula Tracking signal = 3/D- Ft)/MAD = E / MAD The tracking signal is recomputed each period, with updated, "running" values of cumulative error and MAD. The movement of the tracking signal is compared to control limits; as long as the tracking signal is within these limits, the forecast is in control. In part (d), the mean absolute deviation was computed for the exponential smoothing forecast a = 0.30 for Services. Using a tracking signal, monitor the forecast accuracy using control limits of +3 MADs. Plot the results. (10 points)

Step by Step Solution

There are 3 Steps involved in it

1 Expert Approved Answer
Step: 1 Unlock blur-text-image
Question Has Been Solved by an Expert!

Get step-by-step solutions from verified subject matter experts

Step: 2 Unlock
Step: 3 Unlock

Students Have Also Explored These Related General Management Questions!