

Question: 8. Consider the following 3 plots when answering this question. The concentration of hydrogen peroxide was measured at several time intervals. A student collected data
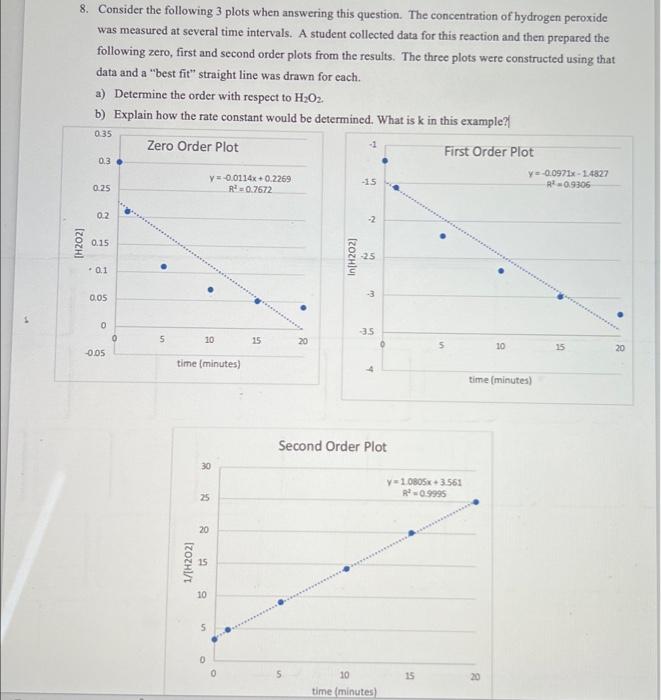
8. Consider the following 3 plots when answering this question. The concentration of hydrogen peroxide was measured at several time intervals. A student collected data for this reaction and then prepared the following zero, first and second order plots from the results. The three plots were constructed using that data and a "best fit" straight line was drawn for each. a) Determine the order with respect to H2O2. b) Explain how the rate constant would be determined. What is k in this example
Step by Step Solution
There are 3 Steps involved in it
1 Expert Approved Answer
Step: 1 Unlock

Question Has Been Solved by an Expert!
Get step-by-step solutions from verified subject matter experts
Step: 2 Unlock
Step: 3 Unlock