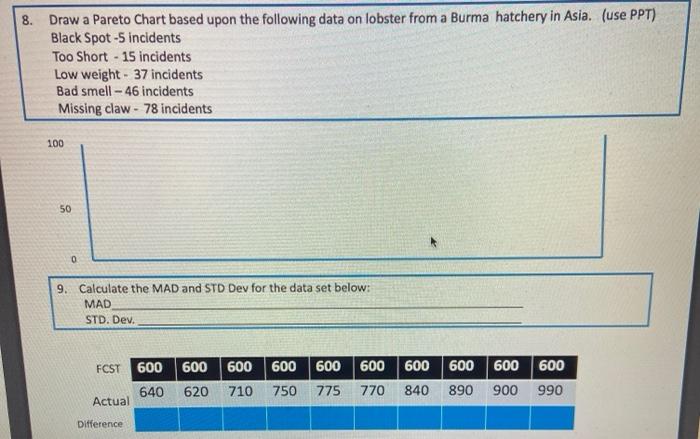
Question: 8. Draw a Pareto Chart based upon the following data on lobster from a Burma hatchery in Asia. (use PPT) Black Spot-5 incidents Too Short

8. Draw a Pareto Chart based upon the following
8. Draw a Pareto Chart based upon the following data on lobster from a Burma hatchery in Asia. (use PPT) Black Spot-5 incidents Too Short - 15 incidents Low weight - 37 incidents Bad smell - 46 incidents Missing claw - 78 incidents 100 50 0 9. Calculate the MAD and STD Dev for the data set below: MAD STD. Dev. FCST 600 600 600 600 600 600 600 600 600 600 990 640 620 710 750 775 770 840 890 900 Actual Difference

Step by Step Solution

There are 3 Steps involved in it

1 Expert Approved Answer
Step: 1 Unlock blur-text-image
Question Has Been Solved by an Expert!

Get step-by-step solutions from verified subject matter experts

Step: 2 Unlock
Step: 3 Unlock

Students Have Also Explored These Related General Management Questions!