

Question: 8. Draw a scatter plot diagram of the data, compute the correlation coefficient, r. Determine whether there is a linear relation between x and y.
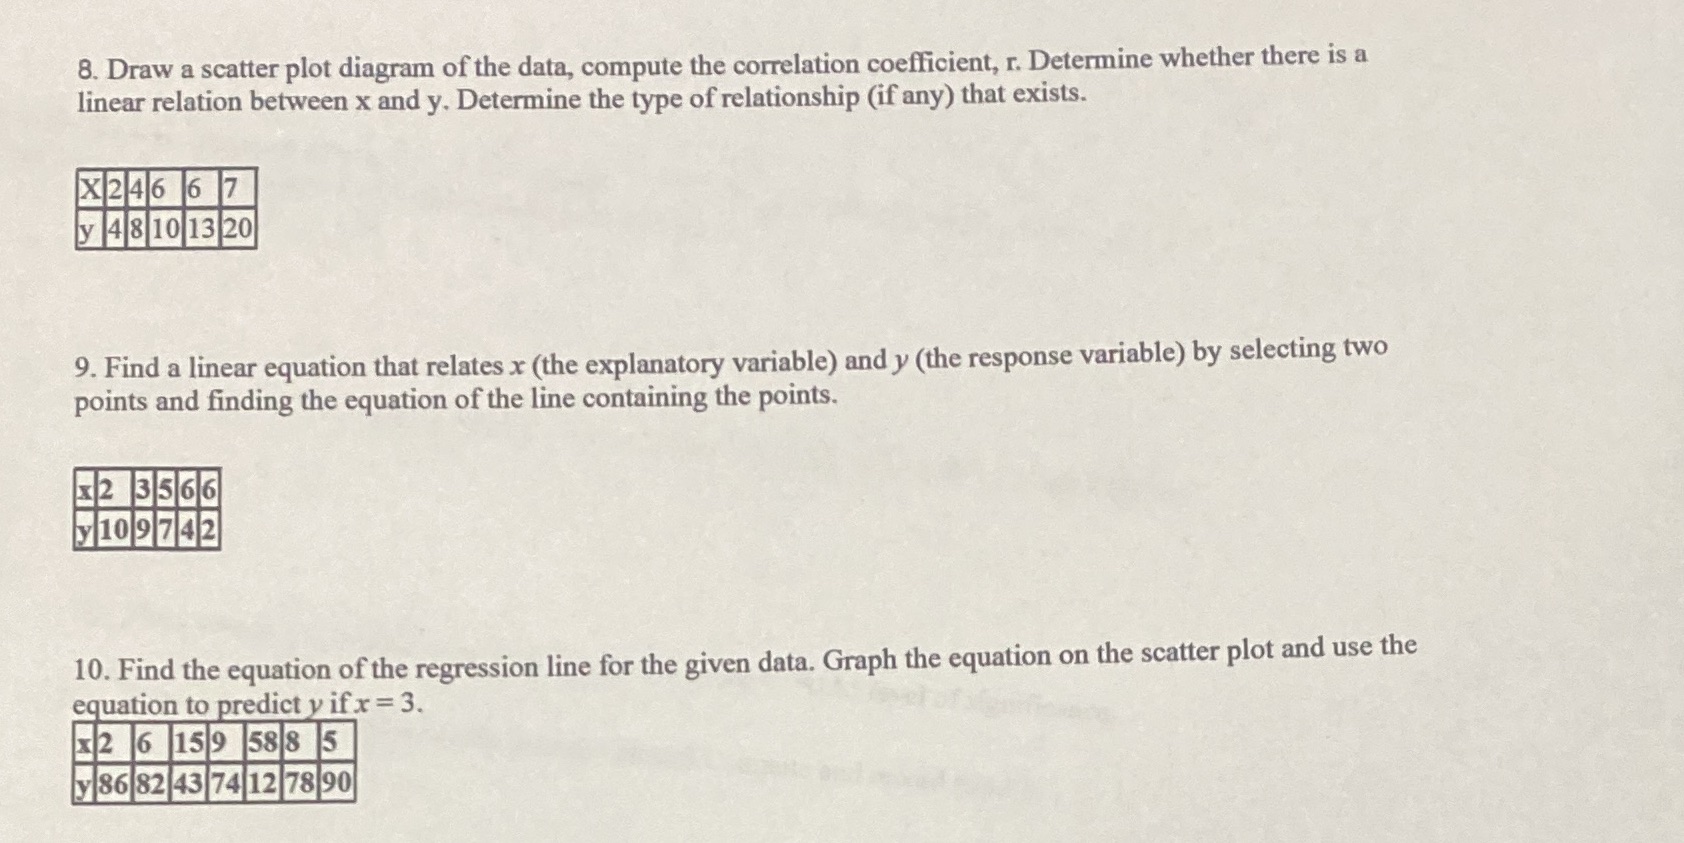
8. Draw a scatter plot diagram of the data, compute the correlation coefficient, r. Determine whether there is a linear relation between x and y. Determine the type of relationship (if any) that exists. X 246 6 7 y 4 8 10 13 20 9. Find a linear equation that relates x (the explanatory variable) and y (the response variable) by selecting two points and finding the equation of the line containing the points. X 2 3 5 6 6 y 10 9 7 42 10. Find the equation of the regression line for the given data. Graph the equation on the scatter plot and use the equation to predict y if x = 3. 2 6 15 9 58 8 5 y 86 82 43 74 12 78 90
Step by Step Solution
There are 3 Steps involved in it
1 Expert Approved Answer
Step: 1 Unlock

Question Has Been Solved by an Expert!
Get step-by-step solutions from verified subject matter experts
Step: 2 Unlock
Step: 3 Unlock