

Question: 8. Expected dividends as a basis for stock values The following graph shows the value of a stock's dividends over time. The stock's current dividend
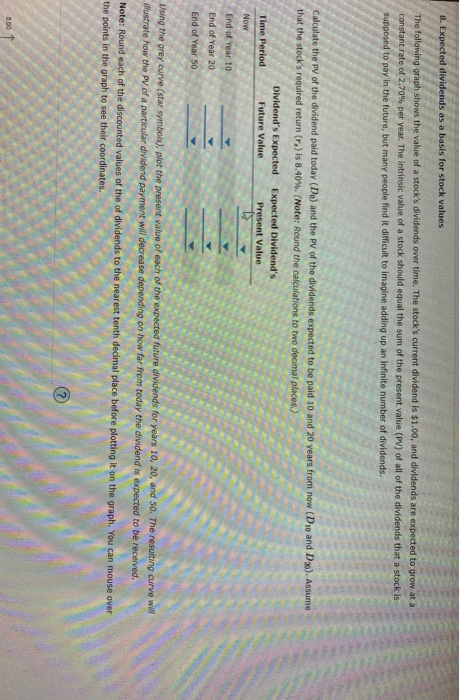
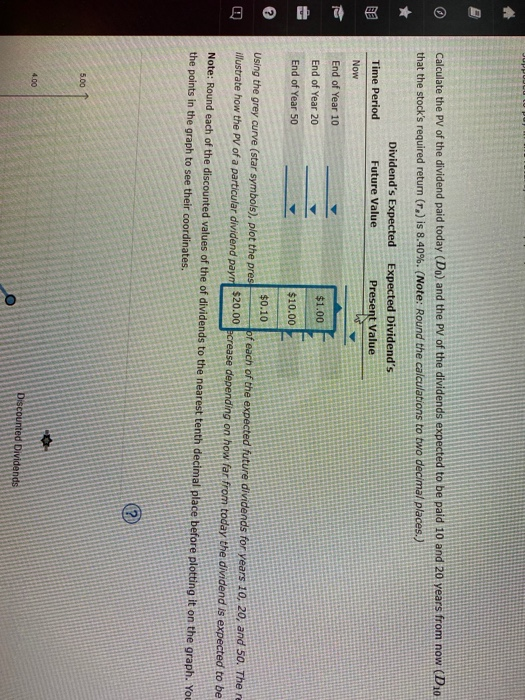
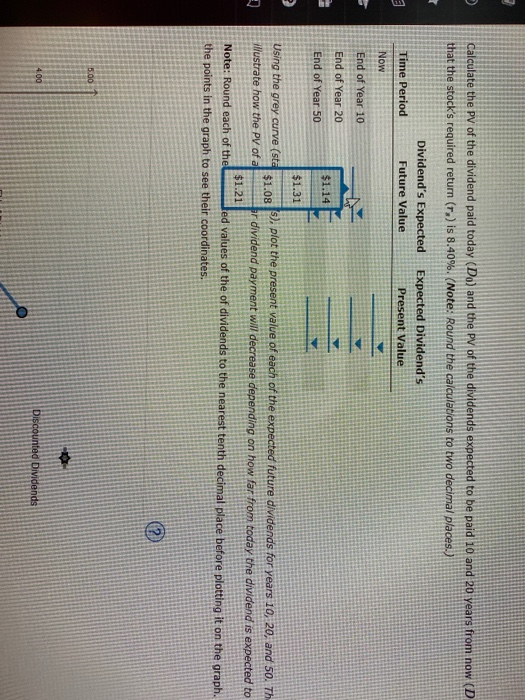
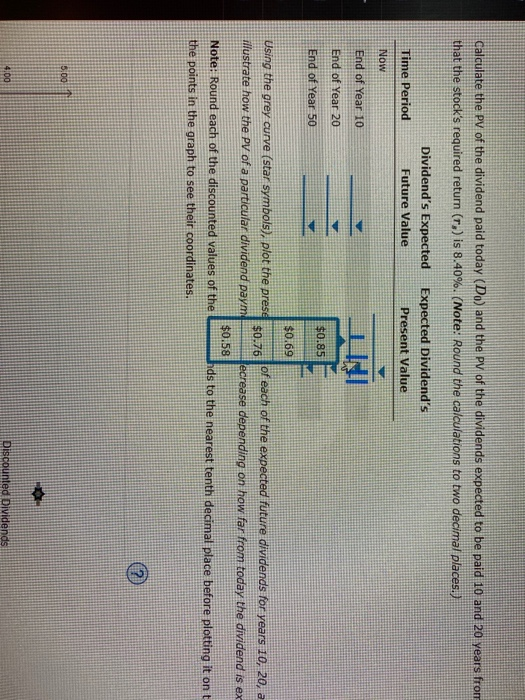
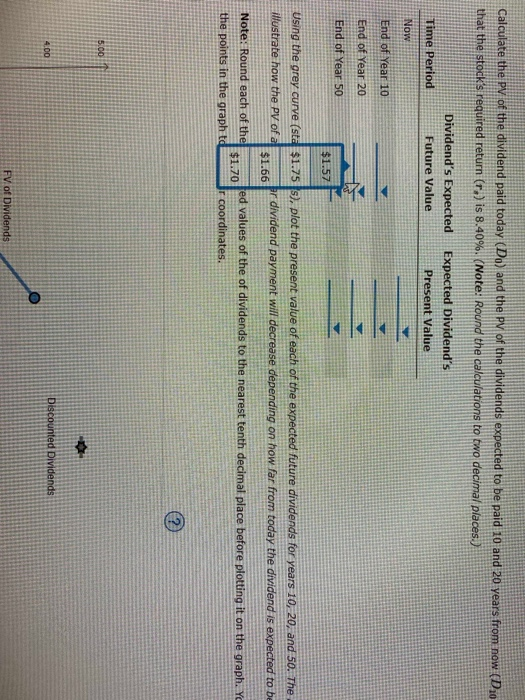
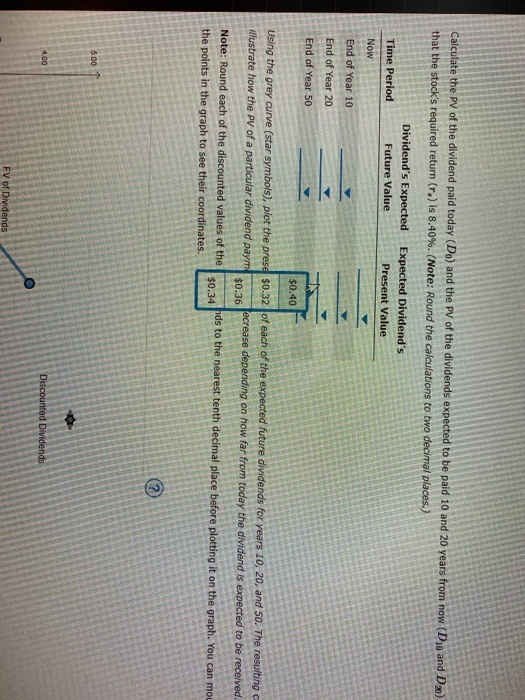
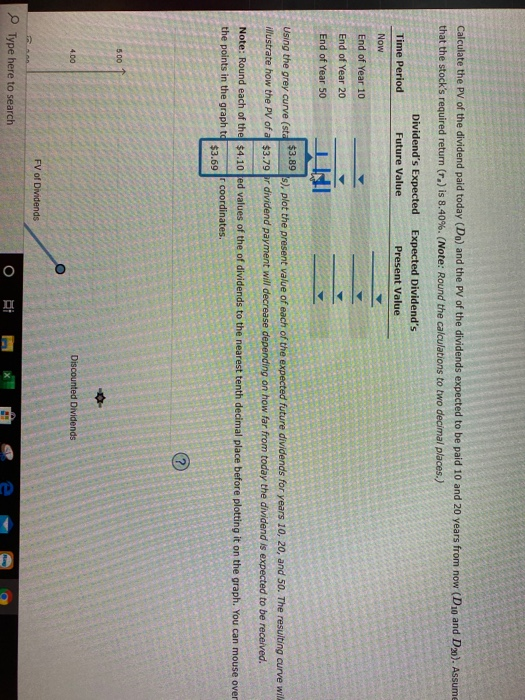
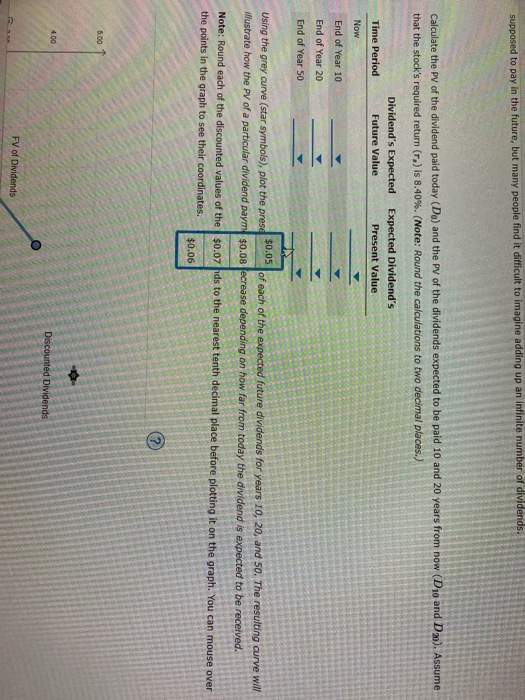
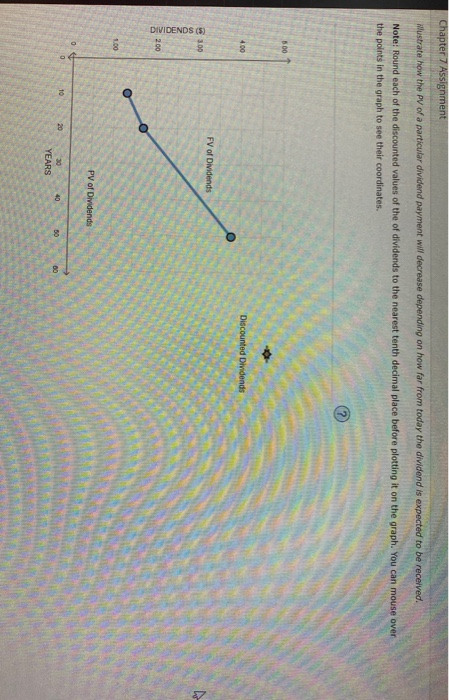
8. Expected dividends as a basis for stock values The following graph shows the value of a stock's dividends over time. The stock's current dividend is $1.00, and dividends are expected to grow at a constant rate of 2.70% per year. The intrinsic value of a stock should equal the sum of the present value (PV) of all of the dividends that a stock is supposed to pay in the future, but many people find it difficult to imagine adding up an Infinite number of dividends. Calculate the PV of the dividend paid today (De) and the PV of the dividends expected to be paid 10 and 20 years from now (D1 and Ds). Assume that the stock's required return (r.) is 8.40%. (Note: Round the calculations to two decimal places.) Dividend's Expected Future Value Time Period Now Expected Dividend's Present Value End of Year 10 End of Year 20 End of Year 50 Using the prey curve (star symbols), plot the present value of each of the expected future dividends for years 10, 20, and so. The resulting curve will wustrate how the PV of a particular dividend payment will decrease depending on how far from today the dividend is expected to be received. Note: Round each of the discounted values of the of dividends to the nearest tenth decimal place before plotting it on the graph. You can mouse over the points in the graph to see their coordinates. 5.00 Calculate the PV of the dividend paid today (Do) and the PV of the dividends expected to be paid 10 and 20 years from now (D10 that the stock's required return (r.) is 8.40%. (Note: Round the calculations to two decimal places.) Dividend's Expected Future Value Expected Dividend's Present Value Time Period Now End of Year 10 End of Year 20 $1.00 End of Year 50 $10.00 $0.10 Using the grey curve (star symbols), plot the pres illustrate how the PV of a particular dividend paym $20.00 of each of the expected future dividends for years 10, 20, and 50. There ecrease depending on how far from today the dividend is expected to be Note: Round each of the discounted values of the of dividends to the nearest tenth decimal place before plotting it on the graph. You the points in the graph to see their coordinates, 5.00 4.00 Discounted Dividends Calculate the PV of the dividend paid today (Do) and the PV of the dividends expected to be paid 10 and 20 years from now (D that the stock's required return (T) is 8.40%. (Note: Round the calculations to two decimal places.) Dividend's Expected Future Value Expected Dividend's Present Value 3 Time Period Now End of Year 10 End of Year 20 End of Year 50 $1.14 $1.31 Using the grey curve (sta s), plot the present value of each of the expected future dividends for years 10, 20, and 50. Th $1.08 illustrate how the PV of a or dividend payment will decrease depending on how far from today the dividend is expected to $1.21 Note: Round each of the ted values of the of dividends to the nearest tenth decimal place before plotting it on the graph. the points in the graph to see their coordinates. 5.00 4.00 Discounted Dividends Calculate the PV of the dividend paid today (Do) and the PV of the dividends expected to be paid 10 and 20 years from that the stock's required return (r.) is 8.40%. (Note: Round the calculations to two decimal places.) Dividend's Expected Future Value Expected Dividend's Present Value Time Period Now YA End of Year 10 End of Year 20 $0.85 End of Year 50 $0.69 Using the grey curve (star symbols), plot the prese $0.76 of each of the expected future dividends for years 10, 20, a illustrate how the PV of a particular dividend payme lecrease depending on how far from today the dividend is ex $0.58 Note: Round each of the discounted values of the hds to the nearest tenth decimal place before plotting it on t the points in the graph to see their coordinates. 5.00 4.00 Discounted Dividends Calculate the PV of the dividend paid today (Do) and the PV of the dividends expected to be paid 10 and 20 years from now (D 10 that the stock's required return (r.) is 8.40%. (Note: Round the calculations to two decimal places.) Dividend's Expected Future Value Expected Dividend's Present Value Time Period Now End of Year 10 End of Year 20 End of Year 50 $1.57 Using the grey curve (sta $1.75 s), plot the present value of each of the expected future dividends for years 10, 20, and 50. The illustrate how the PV of a ar dividend payment will decrease depending on how far from today the dividend is expected to be $1.66 Note: Round each of the fed values of the of dividends to the nearest tenth decimal place before plotting it on the graph. Yo $1.70 the points in the graph td r coordinates. 5.00 4.00 Discounted Dividends FV of Dividends Calculate the PV of the dividend paid today (De) and the PV of the dividends expected to be paid 10 and 20 years from now (D 10 and D20) that the stock's required return (r.) is 8.40%. (Note: Round the calculations to two decimal places.) Dividend's Expected Future Value Time Period Expected Dividend's Present Value Now End of Year 10 End of Year 20 End of Year 50 $0.40 Using the grey curve (star symbols), plot the prese $0.32 of each of the expected future dividends for years 10, 20, and 50. The resulting C illustrate how the PV of a particular dividend paym ecrease depending on how far from today the dividend is expected to be received. $0.36 Note: Round each of the discounted values of the nds to the nearest tenth decimal place before plotting it on the graph. You can mou $0.34 the points in the graph to see their coordinates. 5.00 4.00 Discounted Dividends FV of Dividends Calculate the PV of the dividend paid today (De) and the PV of the dividends expected to be paid 10 and 20 years from now (D10 and D2o). Assume that the stock's required return (r.) is 8.40%. (Note: Round the calculations to two decimal places.) Dividend's Expected Future Value Expected Dividend's Present Value Time Period Now End of Year 10 End of Year 20 End of Year 50 Using the grey curve (sta $3.89 s), plot the present value of each of the expected future dividends for years 10, 20, and 50. The resulting curve wil illustrate how the PV of a $3.79 por dividend payment will decrease depending on how far from today the dividend is expected to be received. Note: Round each of the $4.10 Jed values of the of dividends to the nearest tenth decimal place before plotting it on the graph. You can mouse over the points in the graph td r coordinates. $3.69 500 4.00 Discounted Dividends FV of Dividends Type here to search supposed to pay in the future, but many people find it difficult to imagine adding up an infinite number of dividends. Calculate the PV of the dividend paid today (Do) and the PV of the dividends expect to be paid 10 and 20 years from now (D10 and D20). Assume that the stock's required return (r.) is 8.40%. (Note: Round the calculations to two decimal places.) Dividend's Expected Future Value Expected Dividend's Present Value Time Period Now End of Year 10 End of Year 20 End of Year 50 $0.05 Using the grey curve (star symbols), plot the presa of each of the expected future dividends for years 10, 20, and 50. The resulting curve will illustrate how the PV of a particular dividend paym $0.08 fecrease depending on how far from today the dividend is expected to be received. Note: Round each of the discounted values of the $0.07 hds to the nearest tenth decimal place before plotting it on the graph. You can mouse over the points in the graph to see their coordinates. $0.06 5.00 4.00 Discounted Dividends FV of Dividends Chapter 7 Assignment illustrate how the PV of a particular dividend payment will decrease depending on how far from today the dividend is expected to be received. Note: Round each of the discounted values of the of dividends to the nearest tenth decimal place before plotting it on the graph. You can mouse over the points in the graph to see their coordinates. 000 4.00 Discounted Dividends FV of Dividends 3.00 DIVIDENDS (5) 2.00 1.00 PV of Dividends O 10 20 40 30 YEARS 50 00 8. Expected dividends as a basis for stock values The following graph shows the value of a stock's dividends over time. The stock's current dividend is $1.00, and dividends are expected to grow at a constant rate of 2.70% per year. The intrinsic value of a stock should equal the sum of the present value (PV) of all of the dividends that a stock is supposed to pay in the future, but many people find it difficult to imagine adding up an Infinite number of dividends. Calculate the PV of the dividend paid today (De) and the PV of the dividends expected to be paid 10 and 20 years from now (D1 and Ds). Assume that the stock's required return (r.) is 8.40%. (Note: Round the calculations to two decimal places.) Dividend's Expected Future Value Time Period Now Expected Dividend's Present Value End of Year 10 End of Year 20 End of Year 50 Using the prey curve (star symbols), plot the present value of each of the expected future dividends for years 10, 20, and so. The resulting curve will wustrate how the PV of a particular dividend payment will decrease depending on how far from today the dividend is expected to be received. Note: Round each of the discounted values of the of dividends to the nearest tenth decimal place before plotting it on the graph. You can mouse over the points in the graph to see their coordinates. 5.00 Calculate the PV of the dividend paid today (Do) and the PV of the dividends expected to be paid 10 and 20 years from now (D10 that the stock's required return (r.) is 8.40%. (Note: Round the calculations to two decimal places.) Dividend's Expected Future Value Expected Dividend's Present Value Time Period Now End of Year 10 End of Year 20 $1.00 End of Year 50 $10.00 $0.10 Using the grey curve (star symbols), plot the pres illustrate how the PV of a particular dividend paym $20.00 of each of the expected future dividends for years 10, 20, and 50. There ecrease depending on how far from today the dividend is expected to be Note: Round each of the discounted values of the of dividends to the nearest tenth decimal place before plotting it on the graph. You the points in the graph to see their coordinates, 5.00 4.00 Discounted Dividends Calculate the PV of the dividend paid today (Do) and the PV of the dividends expected to be paid 10 and 20 years from now (D that the stock's required return (T) is 8.40%. (Note: Round the calculations to two decimal places.) Dividend's Expected Future Value Expected Dividend's Present Value 3 Time Period Now End of Year 10 End of Year 20 End of Year 50 $1.14 $1.31 Using the grey curve (sta s), plot the present value of each of the expected future dividends for years 10, 20, and 50. Th $1.08 illustrate how the PV of a or dividend payment will decrease depending on how far from today the dividend is expected to $1.21 Note: Round each of the ted values of the of dividends to the nearest tenth decimal place before plotting it on the graph. the points in the graph to see their coordinates. 5.00 4.00 Discounted Dividends Calculate the PV of the dividend paid today (Do) and the PV of the dividends expected to be paid 10 and 20 years from that the stock's required return (r.) is 8.40%. (Note: Round the calculations to two decimal places.) Dividend's Expected Future Value Expected Dividend's Present Value Time Period Now YA End of Year 10 End of Year 20 $0.85 End of Year 50 $0.69 Using the grey curve (star symbols), plot the prese $0.76 of each of the expected future dividends for years 10, 20, a illustrate how the PV of a particular dividend payme lecrease depending on how far from today the dividend is ex $0.58 Note: Round each of the discounted values of the hds to the nearest tenth decimal place before plotting it on t the points in the graph to see their coordinates. 5.00 4.00 Discounted Dividends Calculate the PV of the dividend paid today (Do) and the PV of the dividends expected to be paid 10 and 20 years from now (D 10 that the stock's required return (r.) is 8.40%. (Note: Round the calculations to two decimal places.) Dividend's Expected Future Value Expected Dividend's Present Value Time Period Now End of Year 10 End of Year 20 End of Year 50 $1.57 Using the grey curve (sta $1.75 s), plot the present value of each of the expected future dividends for years 10, 20, and 50. The illustrate how the PV of a ar dividend payment will decrease depending on how far from today the dividend is expected to be $1.66 Note: Round each of the fed values of the of dividends to the nearest tenth decimal place before plotting it on the graph. Yo $1.70 the points in the graph td r coordinates. 5.00 4.00 Discounted Dividends FV of Dividends Calculate the PV of the dividend paid today (De) and the PV of the dividends expected to be paid 10 and 20 years from now (D 10 and D20) that the stock's required return (r.) is 8.40%. (Note: Round the calculations to two decimal places.) Dividend's Expected Future Value Time Period Expected Dividend's Present Value Now End of Year 10 End of Year 20 End of Year 50 $0.40 Using the grey curve (star symbols), plot the prese $0.32 of each of the expected future dividends for years 10, 20, and 50. The resulting C illustrate how the PV of a particular dividend paym ecrease depending on how far from today the dividend is expected to be received. $0.36 Note: Round each of the discounted values of the nds to the nearest tenth decimal place before plotting it on the graph. You can mou $0.34 the points in the graph to see their coordinates. 5.00 4.00 Discounted Dividends FV of Dividends Calculate the PV of the dividend paid today (De) and the PV of the dividends expected to be paid 10 and 20 years from now (D10 and D2o). Assume that the stock's required return (r.) is 8.40%. (Note: Round the calculations to two decimal places.) Dividend's Expected Future Value Expected Dividend's Present Value Time Period Now End of Year 10 End of Year 20 End of Year 50 Using the grey curve (sta $3.89 s), plot the present value of each of the expected future dividends for years 10, 20, and 50. The resulting curve wil illustrate how the PV of a $3.79 por dividend payment will decrease depending on how far from today the dividend is expected to be received. Note: Round each of the $4.10 Jed values of the of dividends to the nearest tenth decimal place before plotting it on the graph. You can mouse over the points in the graph td r coordinates. $3.69 500 4.00 Discounted Dividends FV of Dividends Type here to search supposed to pay in the future, but many people find it difficult to imagine adding up an infinite number of dividends. Calculate the PV of the dividend paid today (Do) and the PV of the dividends expect to be paid 10 and 20 years from now (D10 and D20). Assume that the stock's required return (r.) is 8.40%. (Note: Round the calculations to two decimal places.) Dividend's Expected Future Value Expected Dividend's Present Value Time Period Now End of Year 10 End of Year 20 End of Year 50 $0.05 Using the grey curve (star symbols), plot the presa of each of the expected future dividends for years 10, 20, and 50. The resulting curve will illustrate how the PV of a particular dividend paym $0.08 fecrease depending on how far from today the dividend is expected to be received. Note: Round each of the discounted values of the $0.07 hds to the nearest tenth decimal place before plotting it on the graph. You can mouse over the points in the graph to see their coordinates. $0.06 5.00 4.00 Discounted Dividends FV of Dividends Chapter 7 Assignment illustrate how the PV of a particular dividend payment will decrease depending on how far from today the dividend is expected to be received. Note: Round each of the discounted values of the of dividends to the nearest tenth decimal place before plotting it on the graph. You can mouse over the points in the graph to see their coordinates. 000 4.00 Discounted Dividends FV of Dividends 3.00 DIVIDENDS (5) 2.00 1.00 PV of Dividends O 10 20 40 30 YEARS 50 00
Step by Step Solution
There are 3 Steps involved in it

Get step-by-step solutions from verified subject matter experts