

Question: 8. For the graph below, describe the local behavior of the function as it approaches the vertical asymptote from the right and left and
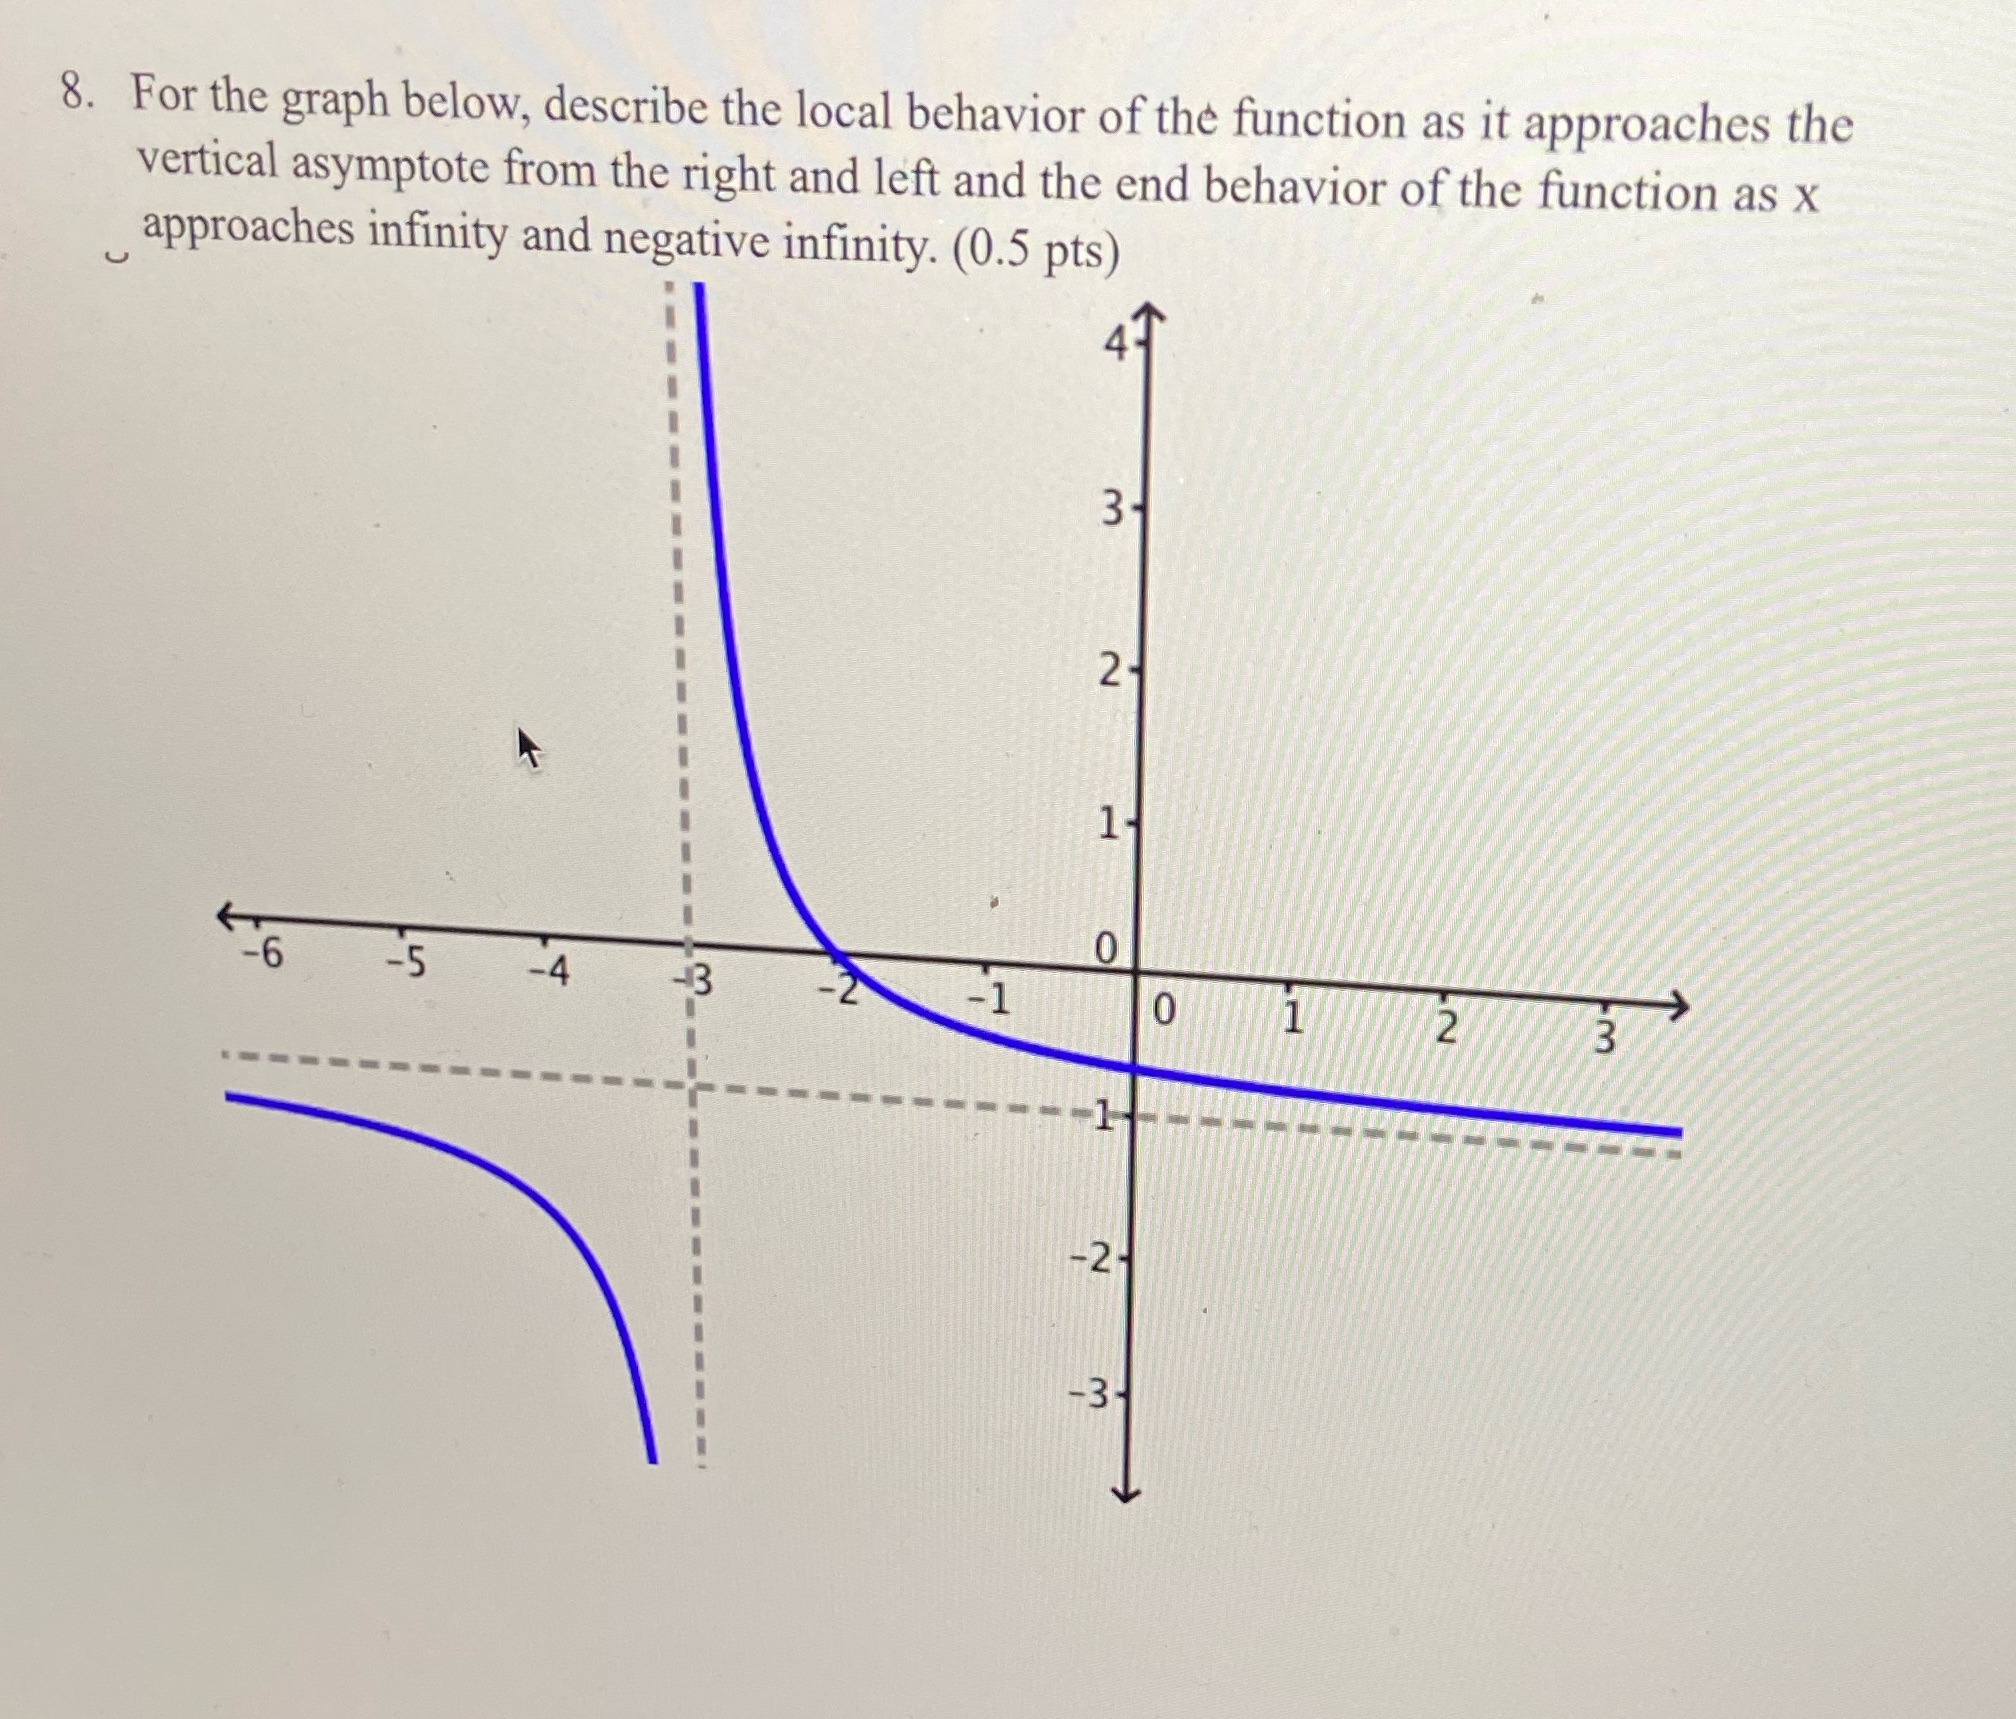
8. For the graph below, describe the local behavior of the function as it approaches the vertical asymptote from the right and left and the end behavior of the function as x approaches infinity and negative infinity. (0.5 pts) K -6 3- 2 1- 0 -5 -4 -3 -1 0 1 2 3 -2- -3- L
Step by Step Solution
There are 3 Steps involved in it
1 Expert Approved Answer
Step: 1 Unlock

Question Has Been Solved by an Expert!
Get step-by-step solutions from verified subject matter experts
Step: 2 Unlock
Step: 3 Unlock