

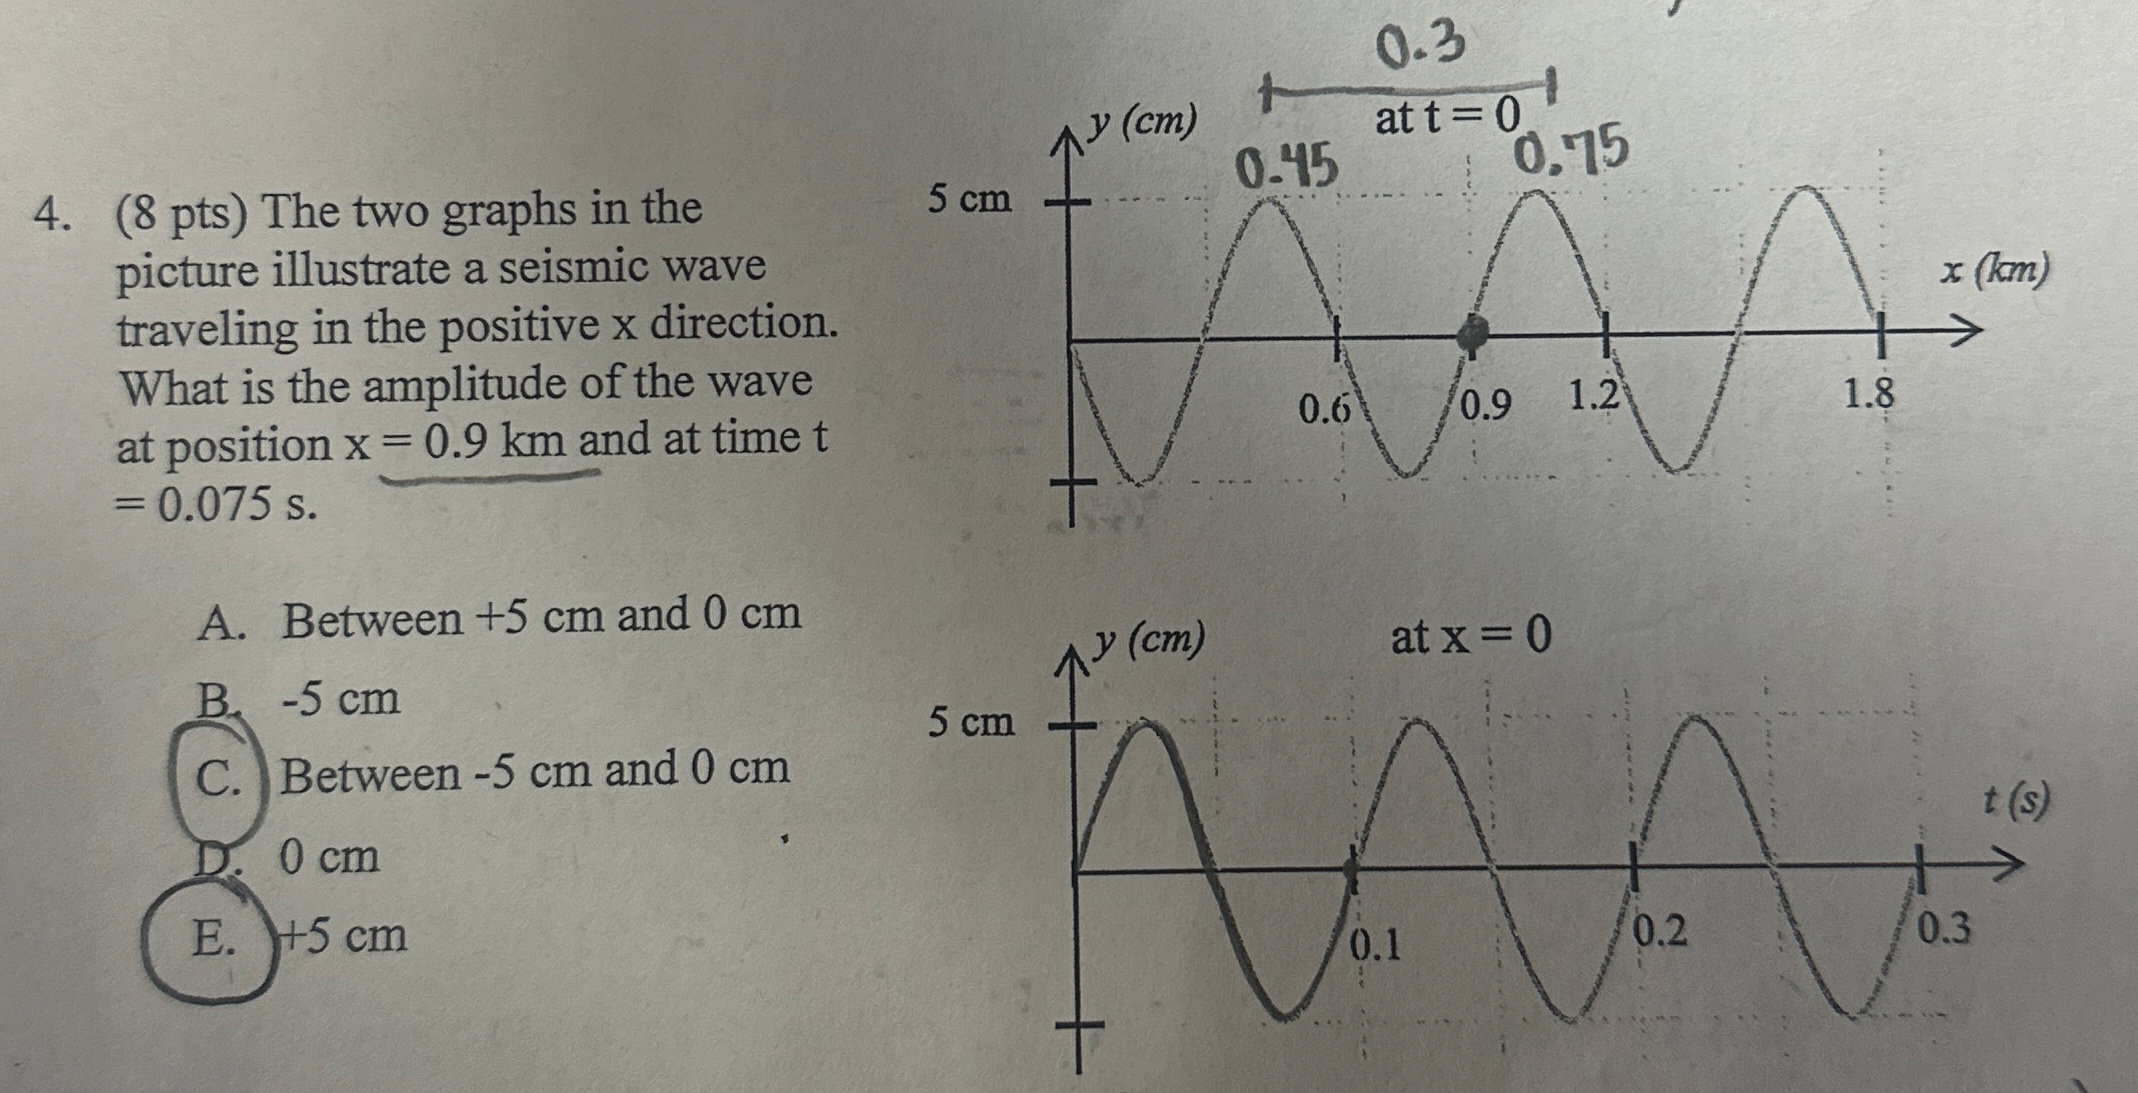
Question: ( 8 p t s ) The two graphs in the picture illustrate a seismic wave traveling in the positive x direction. What is the
The two graphs in the picture illustrate a seismic wave traveling in the positive x direction. What is the amplitude of the wave at position and at time t
A Between cm and cm
B cm
C Between cm and cm
D cm
E cm
Step by Step Solution
There are 3 Steps involved in it
1 Expert Approved Answer
Step: 1 Unlock

Question Has Been Solved by an Expert!
Get step-by-step solutions from verified subject matter experts
Step: 2 Unlock
Step: 3 Unlock