

Question: #8 Please number the graph. also, let me comment back on the post cause i have part B for this question Consider the market for
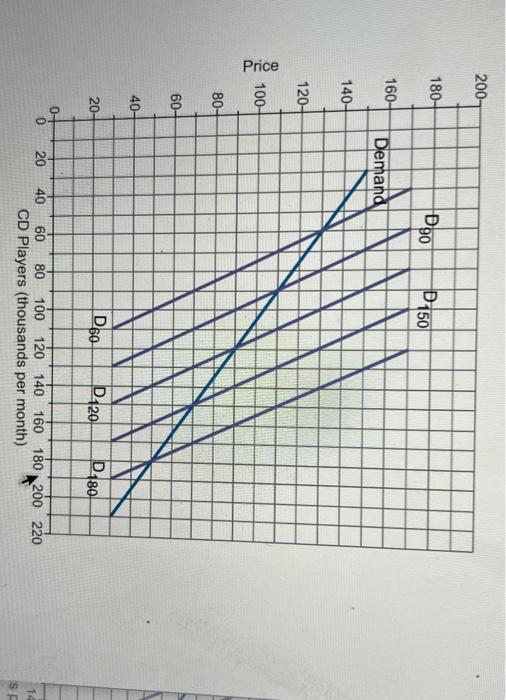
Consider the market for CD players, illustrated in the figure to the right. Suppose there are network externalities in this market such that the quantity of a good demanded grows in response to the growth of purchases by other individuals (as indicated by the demand curve "Demand" in the figure). Suppose that the price is initially $130 where the quantity demanded is 60 (thousand CD players per month). If the price of CD players falls to $110, demand will increase to players per month. (Enter your response using an integer.) thousand CD 200- 180- D90 150 160- Demand 140- 120- Price 100- 80- 60- 40- 20- D60 D120 D180 0- 20 . 40 60 80 100 120 140 160 180 200 220 CD Players (thousands per month) 14 SF
Step by Step Solution
There are 3 Steps involved in it

Get step-by-step solutions from verified subject matter experts