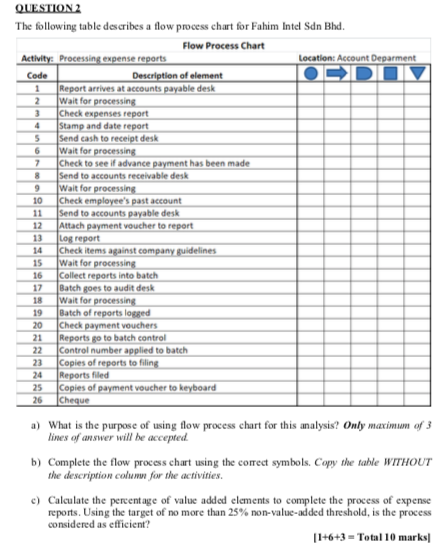
Question: 8 QUESTION 2 The following table describes a flow process chart for Fahim Intel Sdn Bhd. Flow Process Chart Activity: Processing expense reports Location: Account

8 QUESTION 2 The following table describes a flow

8 QUESTION 2 The following table describes a flow process chart for Fahim Intel Sdn Bhd. Flow Process Chart Activity: Processing expense reports Location: Account Deparment Code Description of element Report arrives at accounts payable desk 2 Wait for processing Check expenses report 4 Stamp and date report 5 Send cash to receipt desk 6 Wait for processing 7 Check to see if advance payment has been made Send to accounts receivable desk 9 Wait for processing 10 Check employee's past account Send to accounts payable desk 12 Attach payment voucher to report 13 Log report 14 Check items against company guidelines 15 Wait for processing 16 Collect reports into batch Batch goes to audit desk 18 Wait for processing 19 Batch of reports logged 20 Check payment vouchers 21 Reports go to batch control 22 Control number applied to batch 23 Copies of reports to filing 24 Reports filed 25 Copies of payment voucher to keyboard 26 Cheque 17 a) What is the purpose of using flow process chart for this analysis? Only maximum of 3 lines of answer will be accepted. b) Complete the flow process chart using the correct symbols. Copy the table WITHOUT the description colum for the activities. c) Calculate the percentage of value added elements to complete the process of expense reports. Using the target of no more than 25% non-value-added threshold, is the process considered as efficient? [1+6+3 = Total 10 marks 8 QUESTION 2 The following table describes a flow process chart for Fahim Intel Sdn Bhd. Flow Process Chart Activity: Processing expense reports Location: Account Deparment Code Description of element Report arrives at accounts payable desk 2 Wait for processing Check expenses report 4 Stamp and date report 5 Send cash to receipt desk 6 Wait for processing 7 Check to see if advance payment has been made Send to accounts receivable desk 9 Wait for processing 10 Check employee's past account Send to accounts payable desk 12 Attach payment voucher to report 13 Log report 14 Check items against company guidelines 15 Wait for processing 16 Collect reports into batch Batch goes to audit desk 18 Wait for processing 19 Batch of reports logged 20 Check payment vouchers 21 Reports go to batch control 22 Control number applied to batch 23 Copies of reports to filing 24 Reports filed 25 Copies of payment voucher to keyboard 26 Cheque 17 a) What is the purpose of using flow process chart for this analysis? Only maximum of 3 lines of answer will be accepted. b) Complete the flow process chart using the correct symbols. Copy the table WITHOUT the description colum for the activities. c) Calculate the percentage of value added elements to complete the process of expense reports. Using the target of no more than 25% non-value-added threshold, is the process considered as efficient? [1+6+3 = Total 10 marks

Step by Step Solution

There are 3 Steps involved in it

1 Expert Approved Answer
Step: 1 Unlock blur-text-image
Question Has Been Solved by an Expert!

Get step-by-step solutions from verified subject matter experts

Step: 2 Unlock
Step: 3 Unlock

Students Have Also Explored These Related General Management Questions!