

Question: 8 QUESTION 5 1 points Save Answer Bob also collects data on household incomes eg ($23671, $86246 etc). What is the most appropriate graph to
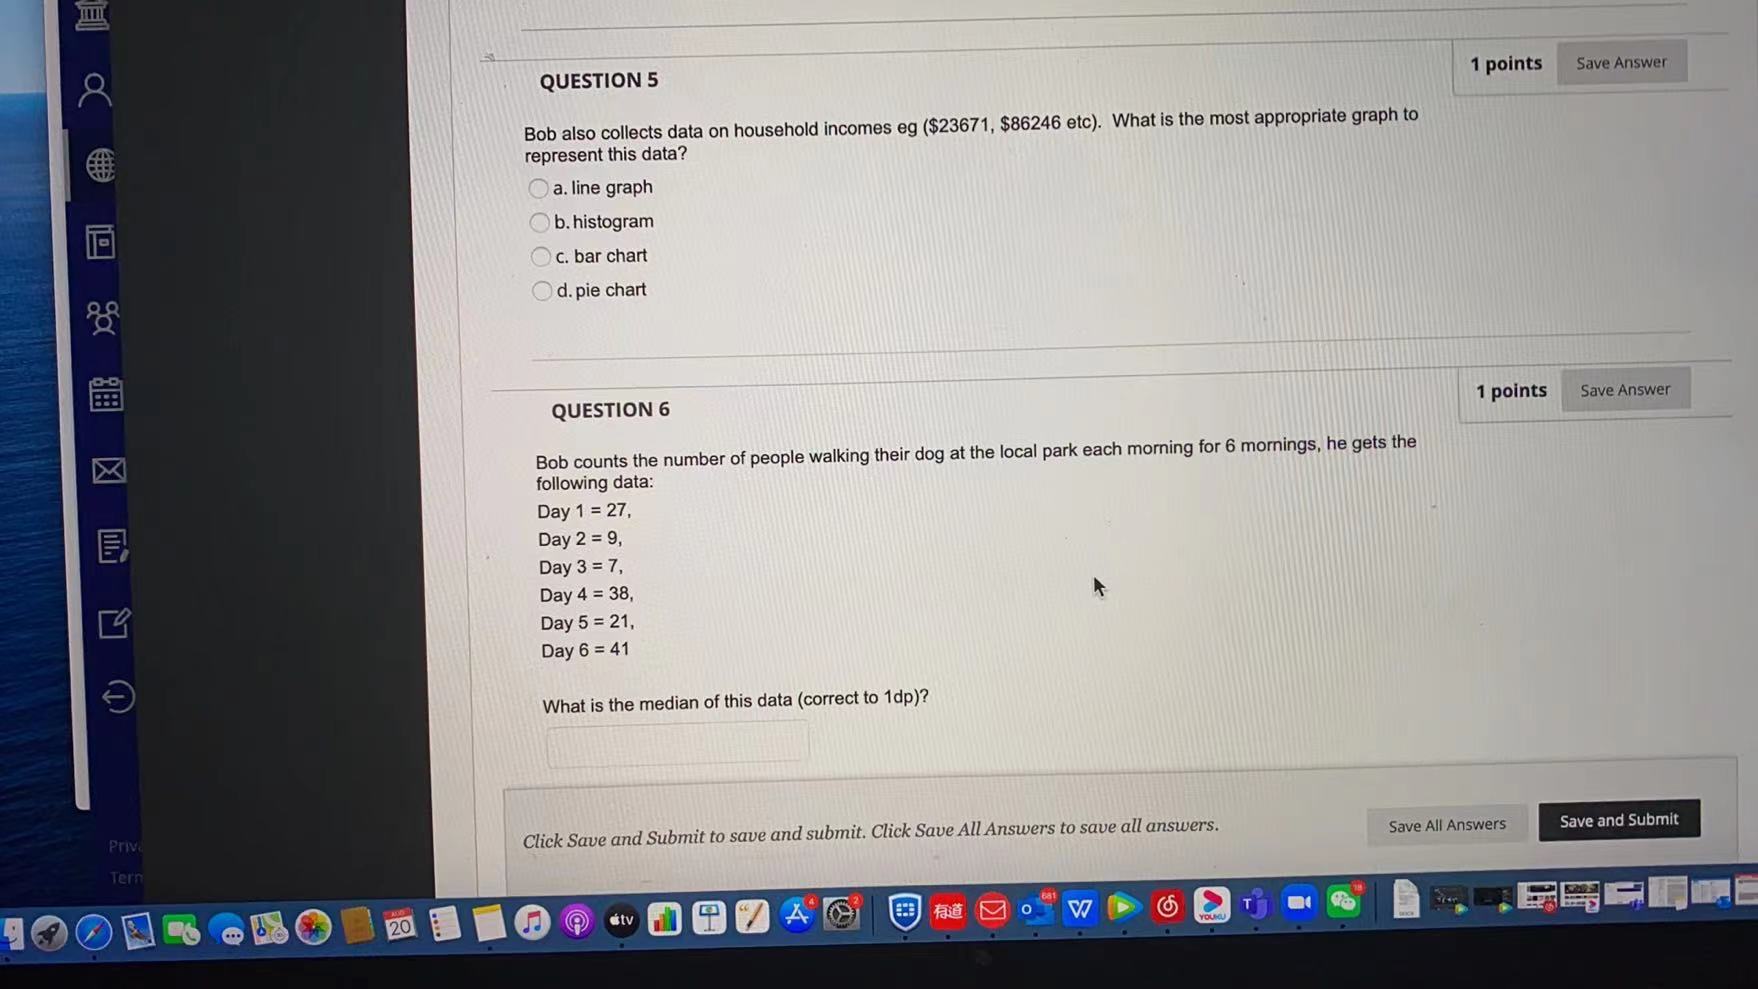
8 QUESTION 5 1 points Save Answer Bob also collects data on household incomes eg ($23671, $86246 etc). What is the most appropriate graph to represent this data? Oa. line graph b. histogram c. bar chart Od. pie chart QUESTION 6 1 points Save Answer X Bob counts the number of people walking their dog at the local park each morning for 6 mornings, he gets the following data: Day 1 = 27, Day 2 = 9, Day 3 = 7, Day 4 = 38, Day 5 = 21, Day 6 = 41 What is the median of this data (correct to 1dp)? Priv Click Save and Submit to save and submit. Click Save All Answers to save all answers. Save All Answers Save and Submit Tern 20 City O V7
Step by Step Solution
There are 3 Steps involved in it
1 Expert Approved Answer
Step: 1 Unlock

Question Has Been Solved by an Expert!
Get step-by-step solutions from verified subject matter experts
Step: 2 Unlock
Step: 3 Unlock