

Question: 8 seconds 3 Multiple Choice 1 point Given the graph below, which of the following represents the shaded region in the graph? - 1 0
seconds
Multiple Choice point
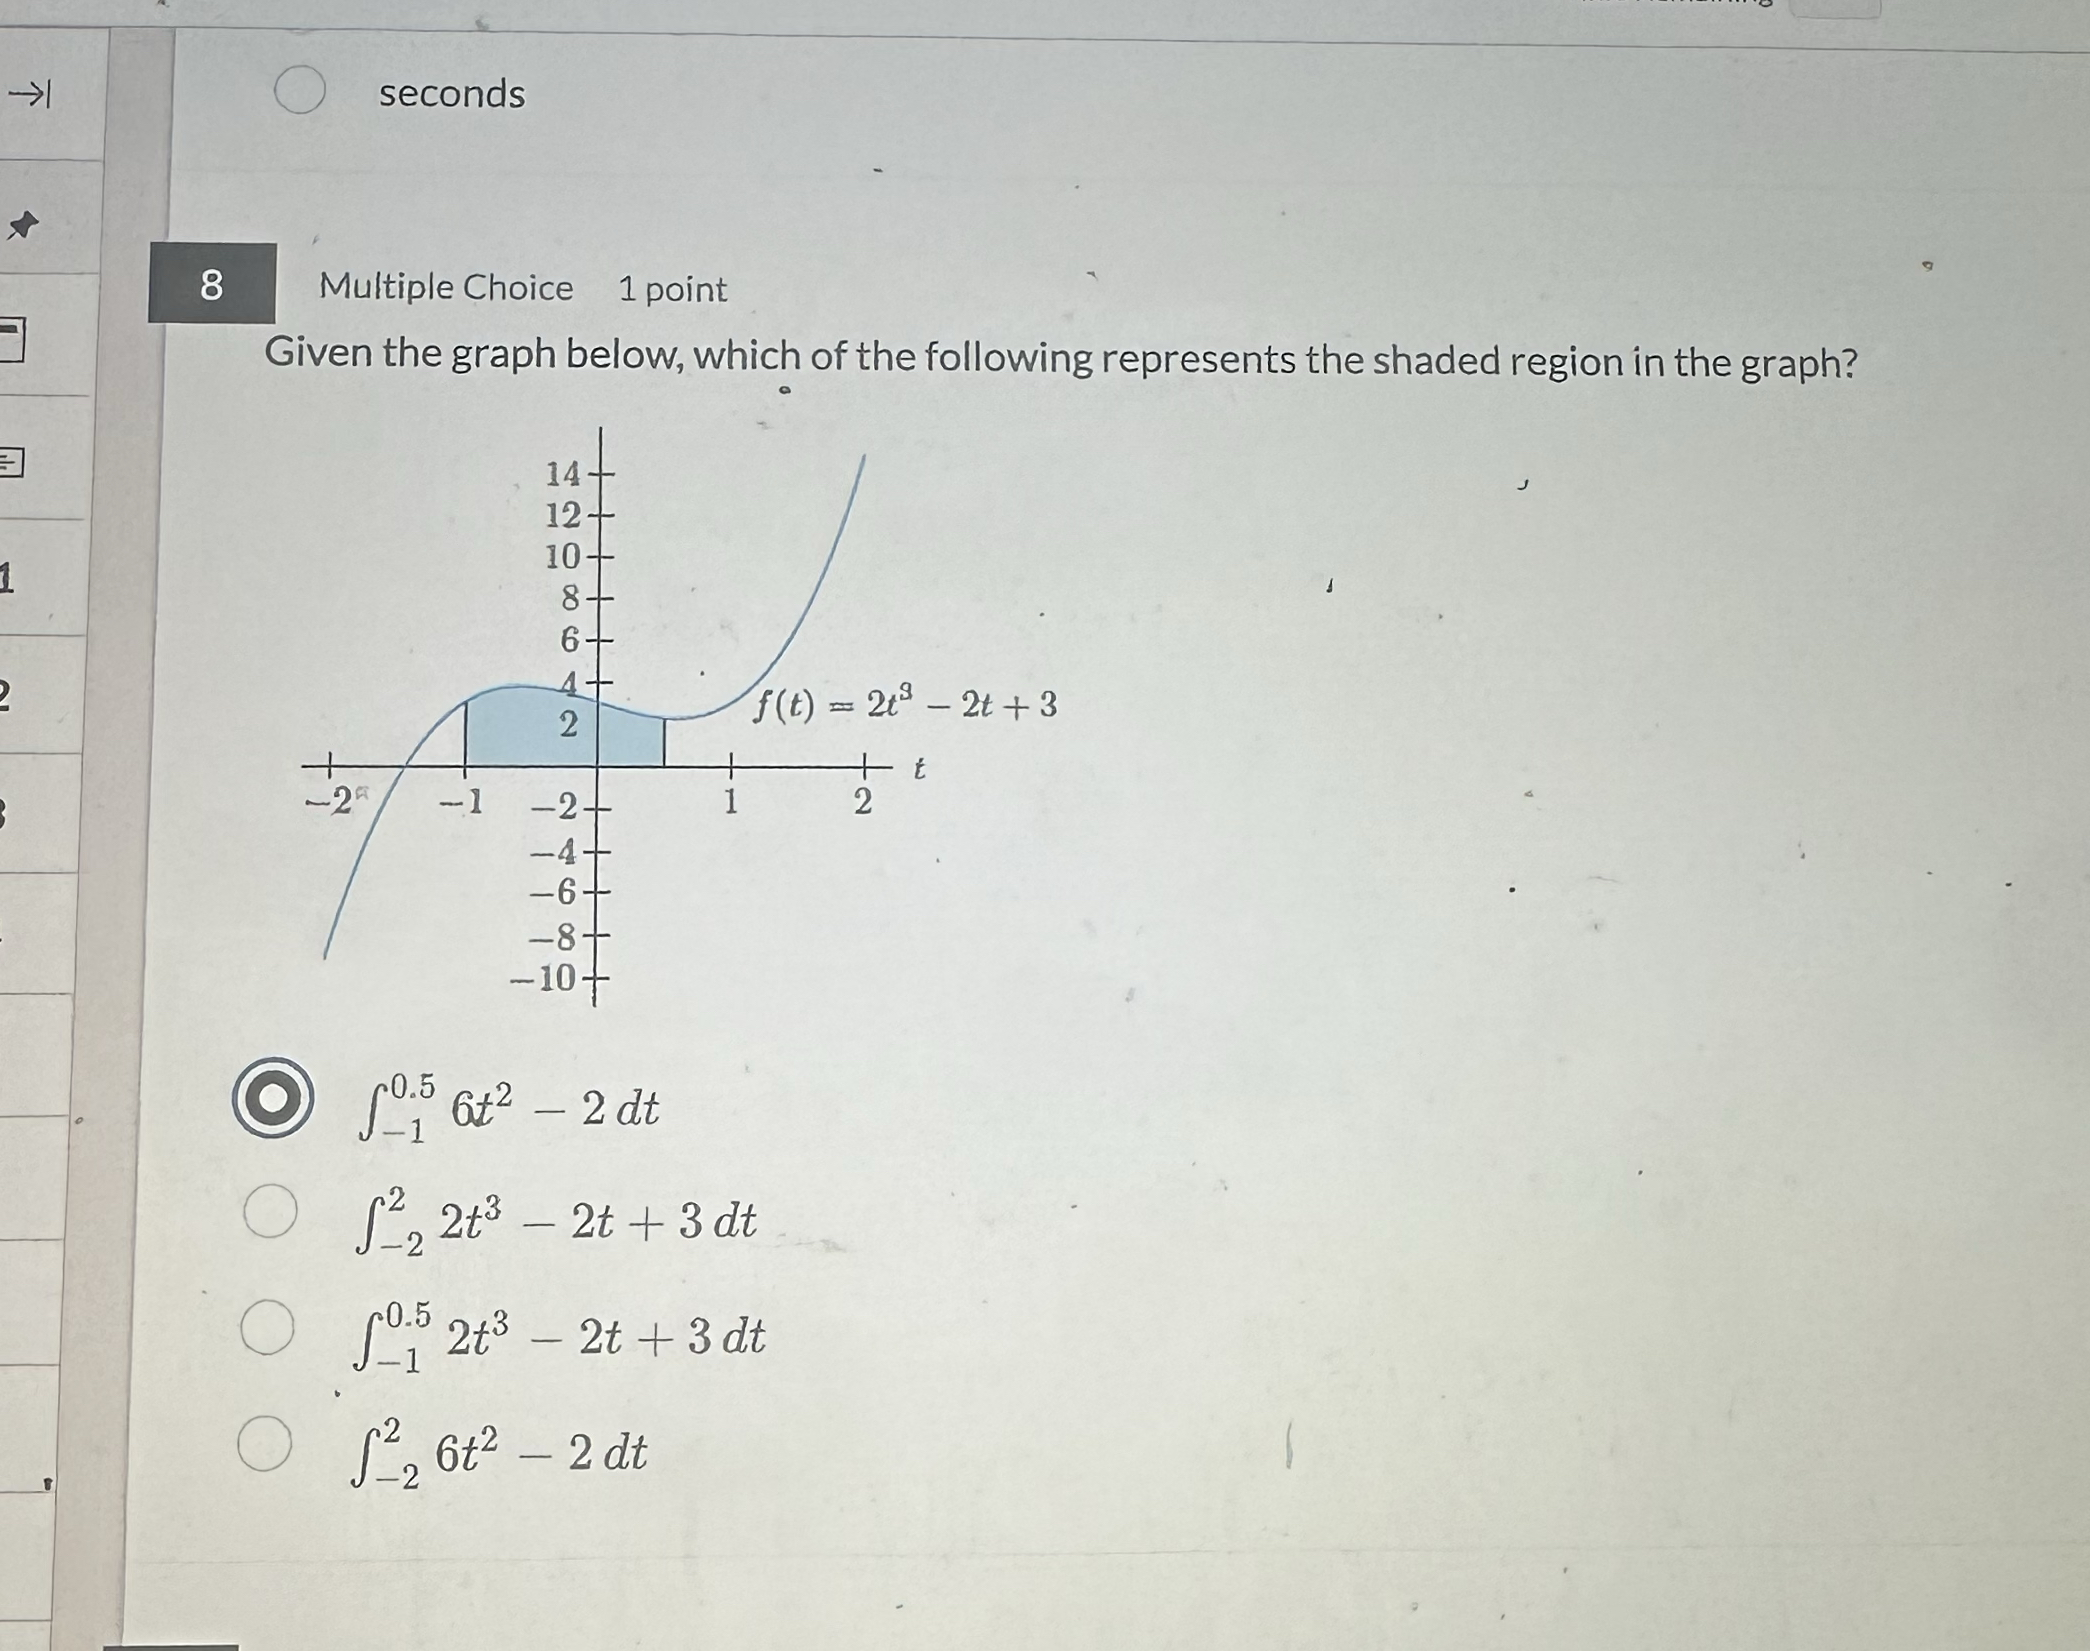
Given the graph below, which of the following represents the shaded region in the graph?
Step by Step Solution
There are 3 Steps involved in it
1 Expert Approved Answer
Step: 1 Unlock

Question Has Been Solved by an Expert!
Get step-by-step solutions from verified subject matter experts
Step: 2 Unlock
Step: 3 Unlock