

Question: 8. The CFO would also like you to prepare some data visualizations that depict monthly trends in the cash balance, current assets, and net income.
8. The CFO would also like you to prepare some data visualizations that depict monthly trends in the cash balance, current assets, and net income. Accordingly, use Charts to do the following:
a. Go to the Cash Budget tab and create a bar chart that includes one bar for each of 12 months. Each months bar will show the excess (deficiency) of cash available over disbursements for that month and (where appropriate) the borrowings for that month. Use different colors to distinguish the excess (deficiency) of cash available over disbursements from any borrowings. Also, insert a horizontal line within your chart to depict the companys minimum cash balance of $30,000.
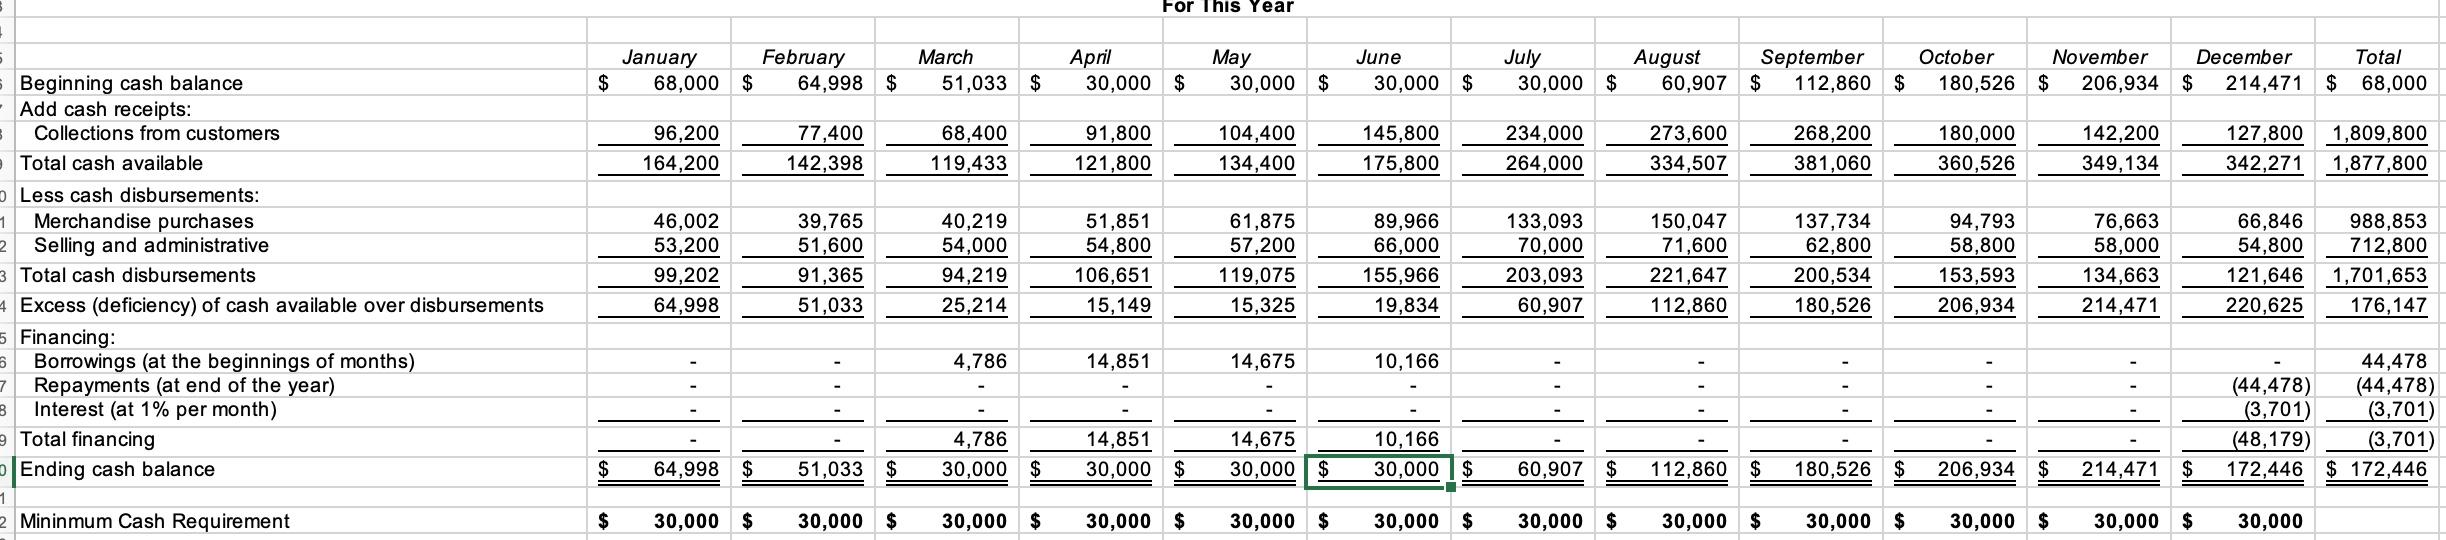
b. Which of the following statements are true based on the bar chart that you created in requirement 8a?
check all that apply 4
The company's cash collections in February are greater than its cash disbursements during that same month.unanswered
The company's excess (deficiency) of cash available over disbursements peaks in December.unanswered
The company's excess (deficiency) of cash available over disbursements hits its lowest point in March.unanswered
The company needs to borrow money during the year including borrowings in May and June.unanswered
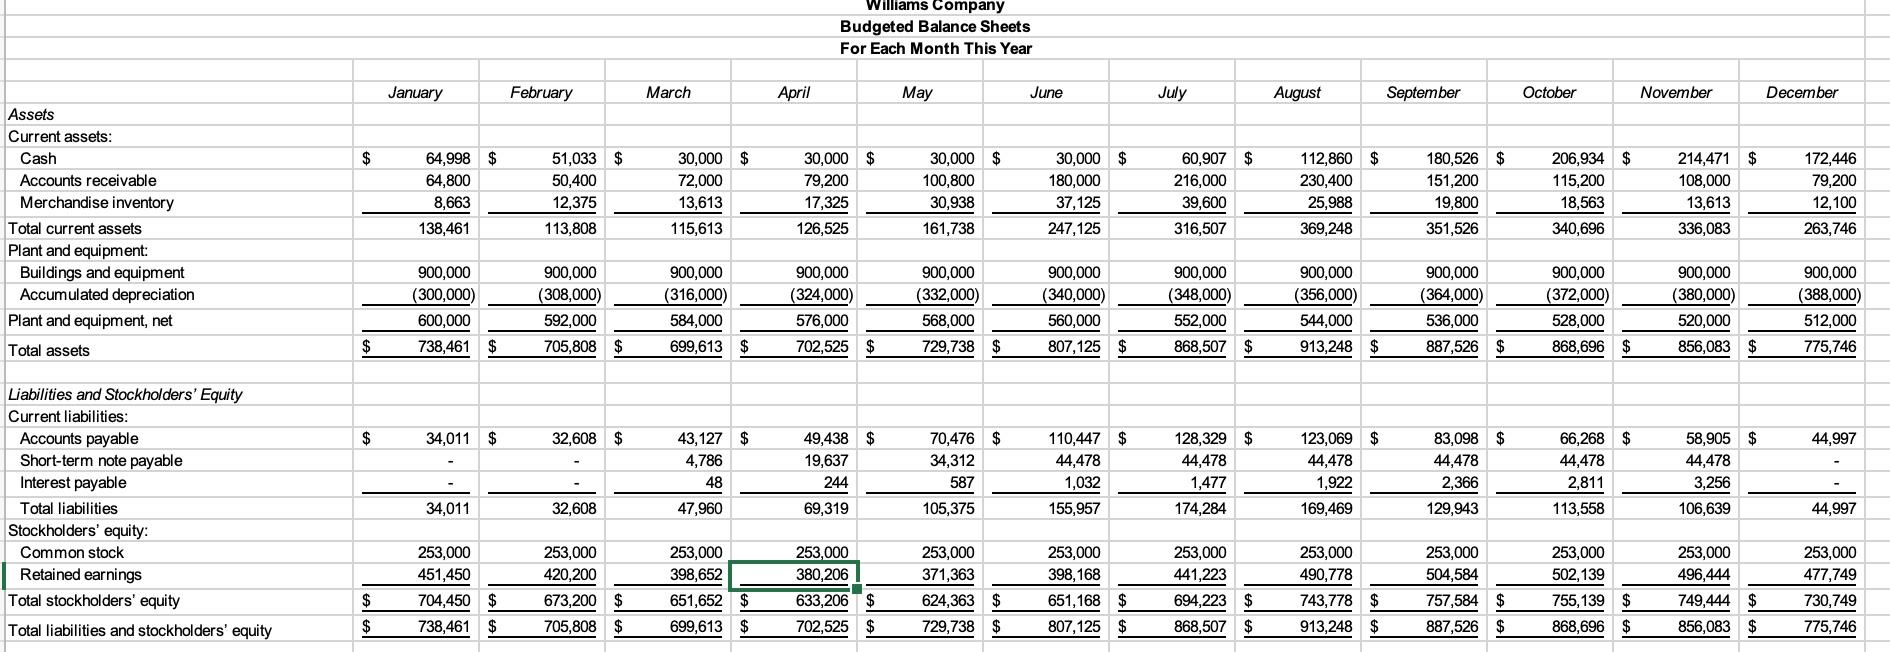
c. Go to the Budgeted Balance Sheets tab and create a bar chart that depicts each months ending total current assets. Each bar within the chart will sub-divide into three partsthe portion of the overall balance that resides in cash, accounts receivable, and inventory.
d. Which of the following statements are true based on the bar chart that you created in requirement 8c?
check all that apply 5
The total current assets are highest in June and July.unanswered
Accounts receivable comprise the largest portion of Augusts current assets.unanswered
The cash balance peaks in November.unanswered
Inventory comprises the largest portion of the total current assets in June.unanswered
e. Go to the Cash Flow vs. Net Income tab and create a line chart that includes a total of two lines. The first line will depict monthly trends in operating cash flows (cash collections from customers minus total cash disbursements, including interest payments) and the second line will depict net income.
 Which of the following statements are true based on the line chart that you created in requirement 8e?
check all that apply 6
The net income and operating cash flows peak in August.unanswered
The net income and operating cash flows peak in September.unanswered
The net income lags operating cash flows.unanswered
The operating cash flows lag net income.
Step by Step Solution
There are 3 Steps involved in it

Get step-by-step solutions from verified subject matter experts