

Question: 8. The function f is graphed on the semi-log plot to the right where 10 the vertical axis has been logarithmically scaled. Write an equation

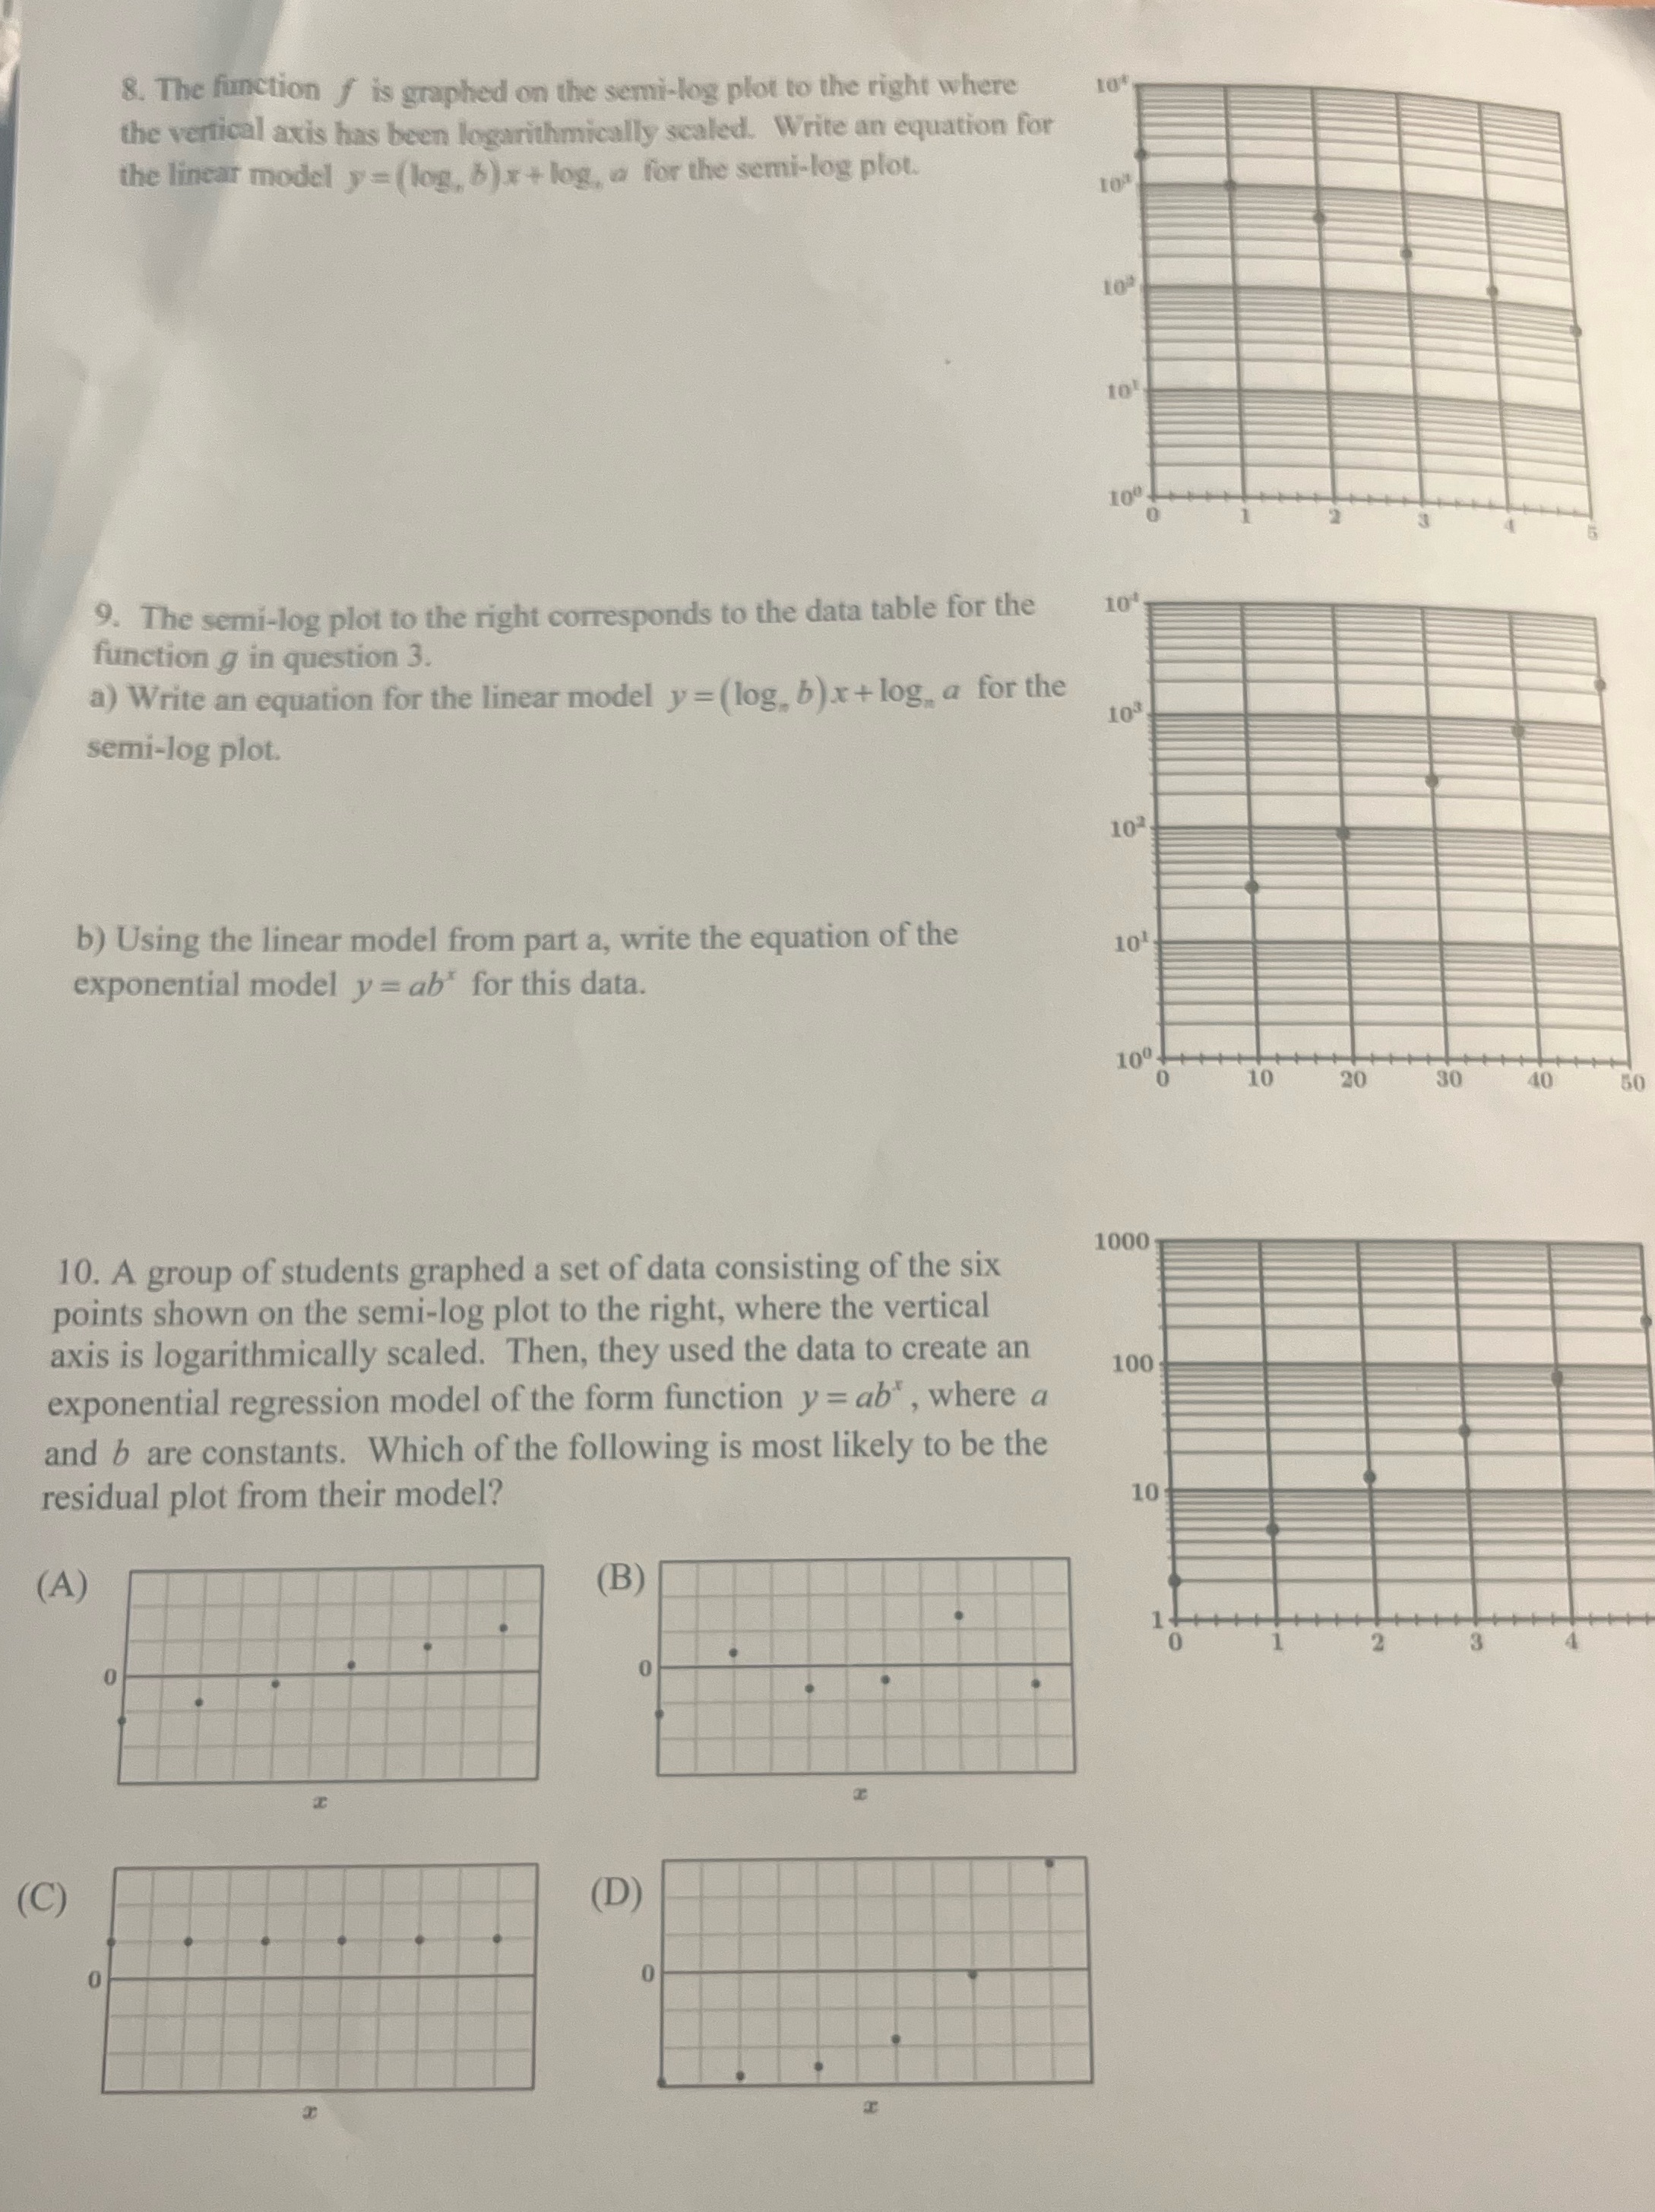
8. The function f is graphed on the semi-log plot to the right where 10 the vertical axis has been logarithmically scaled. Write an equation for the linear model y = (log, b)x + log, a for the semi-log plot. 100 9. The semi-log plot to the right corresponds to the data table for the function g in question 3. a) Write an equation for the linear model y = (log, b)x + log, a for the 10 semi-log plot. 10 b) Using the linear model from part a, write the equation of the 101 exponential model y = ab* for this data. 100 10 20 30 40 50 10. A group of students graphed a set of data consisting of the six 1000 points shown on the semi-log plot to the right, where the vertical axis is logarithmically scaled. Then, they used the data to create an 100 exponential regression model of the form function y = ab* , where a and b are constants. Which of the following is most likely to be the residual plot from their model? 10 (A) (B) (C) (D)
Step by Step Solution
There are 3 Steps involved in it

Get step-by-step solutions from verified subject matter experts