

Question: 8. Using the data below and your knowledge from Mr. Clifford's video, answer the questions that follow this chart showing the marginal utility for goods
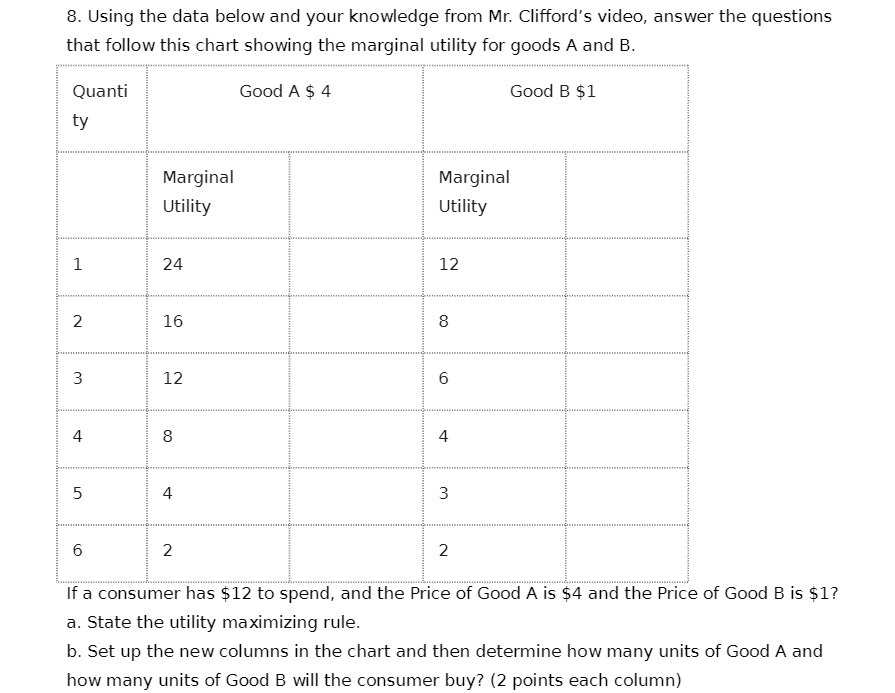
8. Using the data below and your knowledge from Mr. Clifford's video, answer the questions that follow this chart showing the marginal utility for goods A and B. Quanti Good A $ 4 Good B $1 ty Marginal Marginal Utility Utility 1 24 12 2 16 8 12 6 4 8 4 5 1 3 6 2 2 If a consumer has $12 to spend, and the Price of Good A is $4 and the Price of Good B is $1? a. State the utility maximizing rule. b. Set up the new columns in the chart and then determine how many units of Good A and how many units of Good B will the consumer buy? (2 points each column)
Step by Step Solution
There are 3 Steps involved in it
1 Expert Approved Answer
Step: 1 Unlock

Question Has Been Solved by an Expert!
Get step-by-step solutions from verified subject matter experts
Step: 2 Unlock
Step: 3 Unlock