

Question: 8 . value: 6.66 points Problem 3-26 The following table shows the past two years of quarterly sales information. Assume that there are both trend
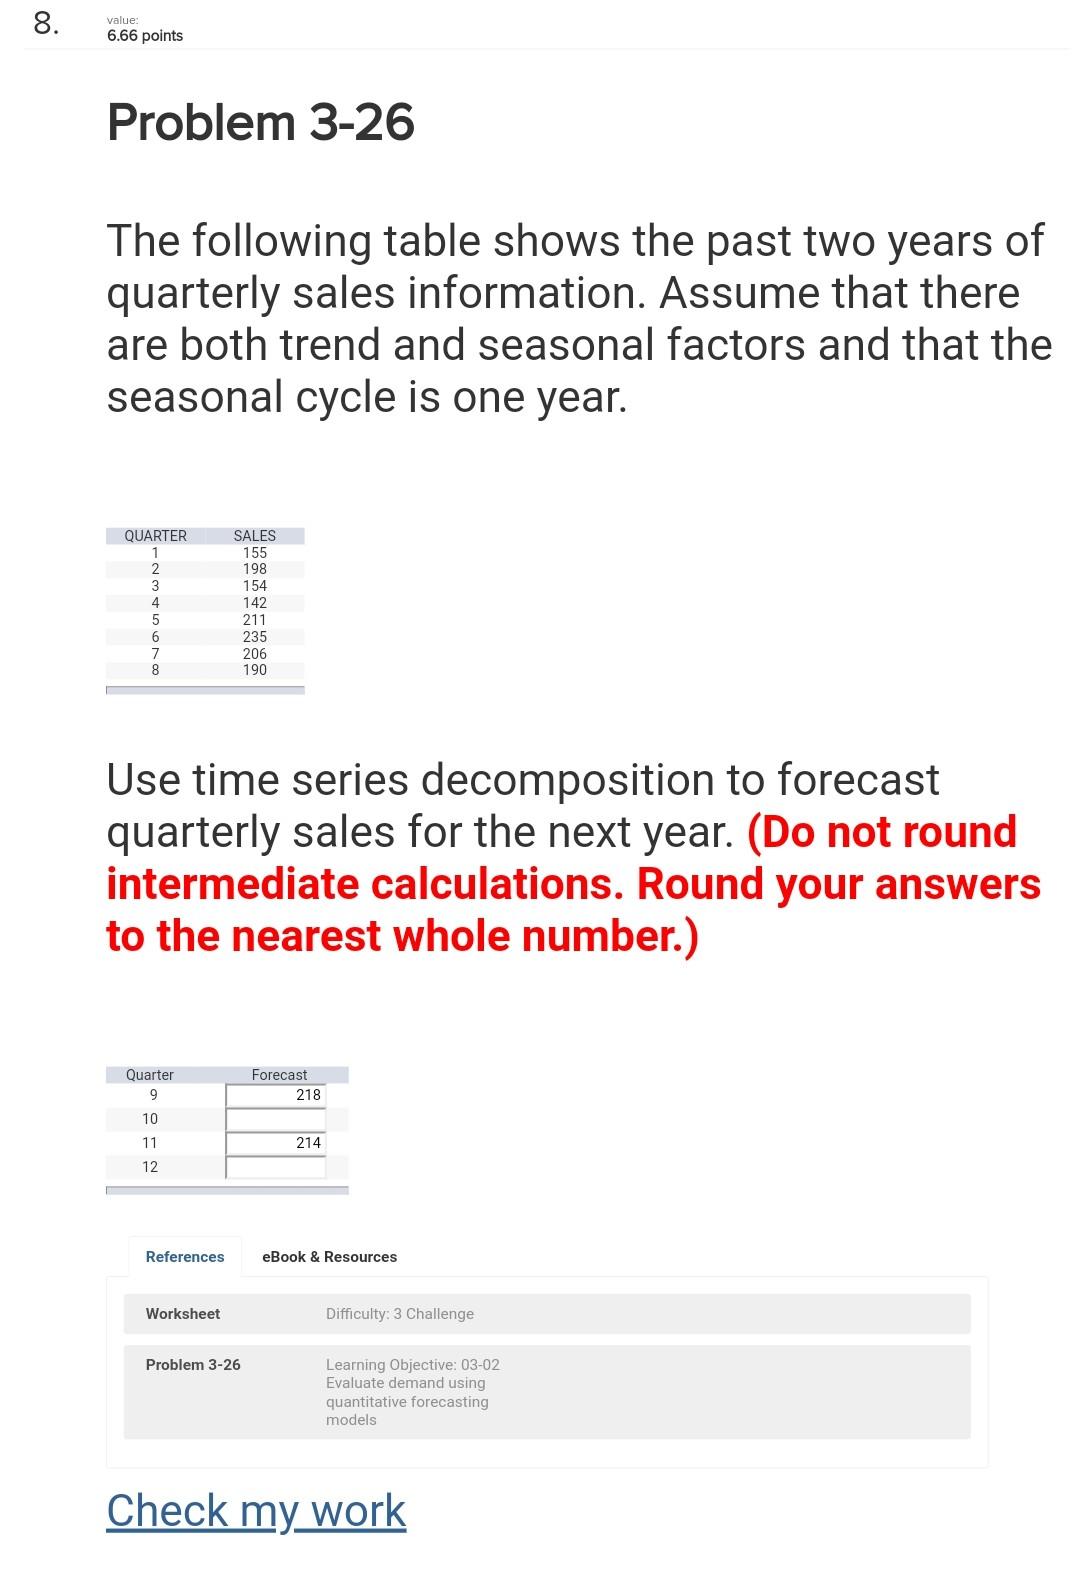
8 . value: 6.66 points Problem 3-26 The following table shows the past two years of quarterly sales information. Assume that there are both trend and seasonal factors and that the seasonal cycle is one year. QUARTER 2 3 4 5 6 7 8 SALES 155 198 154 142 211 235 206 190 Use time series decomposition to forecast quarterly sales for the next year. (Do not round intermediate calculations. Round your answers to the nearest whole number.) Quarter 9 Forecast 218 10 11 214 12 References eBook & Resources Worksheet Difficulty: 3 Challenge Problem 3-26 Learning Objective: 03-02 Evaluate demand using quantitative forecasting models Check my work
Step by Step Solution
There are 3 Steps involved in it
1 Expert Approved Answer
Step: 1 Unlock

Question Has Been Solved by an Expert!
Get step-by-step solutions from verified subject matter experts
Step: 2 Unlock
Step: 3 Unlock