

Question: 80. The table below compares two samples taken to compare the mean age of individuals who purchased the iPhone 3G at two AT&T store locations.
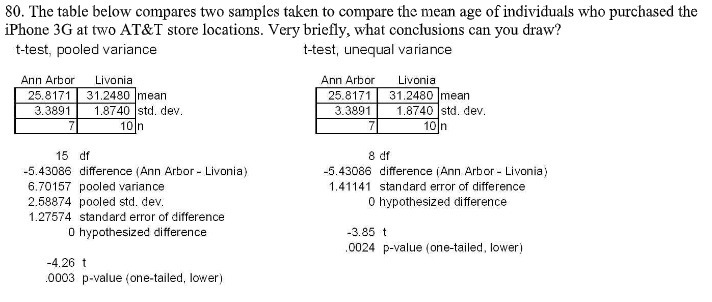
80. The table below compares two samples taken to compare the mean age of individuals who purchased the iPhone 3G at two AT&T store locations. Very briefly, what conclusions can you draw? t-test, pooled variance t-test, unequal variance Ann Arbor Livonia Ann Arbor Livonia 25.8171 31.2480 mean 25.8171 31.2480 mean 3.3891 1.8740 std. dev. 3.3891 1.8740 std. dev. 10 n 10 In 15 df 8 df -5.43086 difference (Ann Arbor - Livonia) -5.43086 difference (Ann Arbor - Livonia) 6.70157 pooled variance 1.41141 standard error of difference 2.58874 pooled std. dev. 0 hypothesized difference 1.27574 standard error of difference 0 hypothesized difference -3.85 t 0024 p-value (one-tailed, lower) -4.26 t 0003 p-value (one-tailed, lower)
Step by Step Solution
There are 3 Steps involved in it

Get step-by-step solutions from verified subject matter experts