

Question: 801:20:30 a-1. Select the correct data chart and fit an appropriate model to it a-2. Forecast the preceding eight years, and determine the forecast errors.
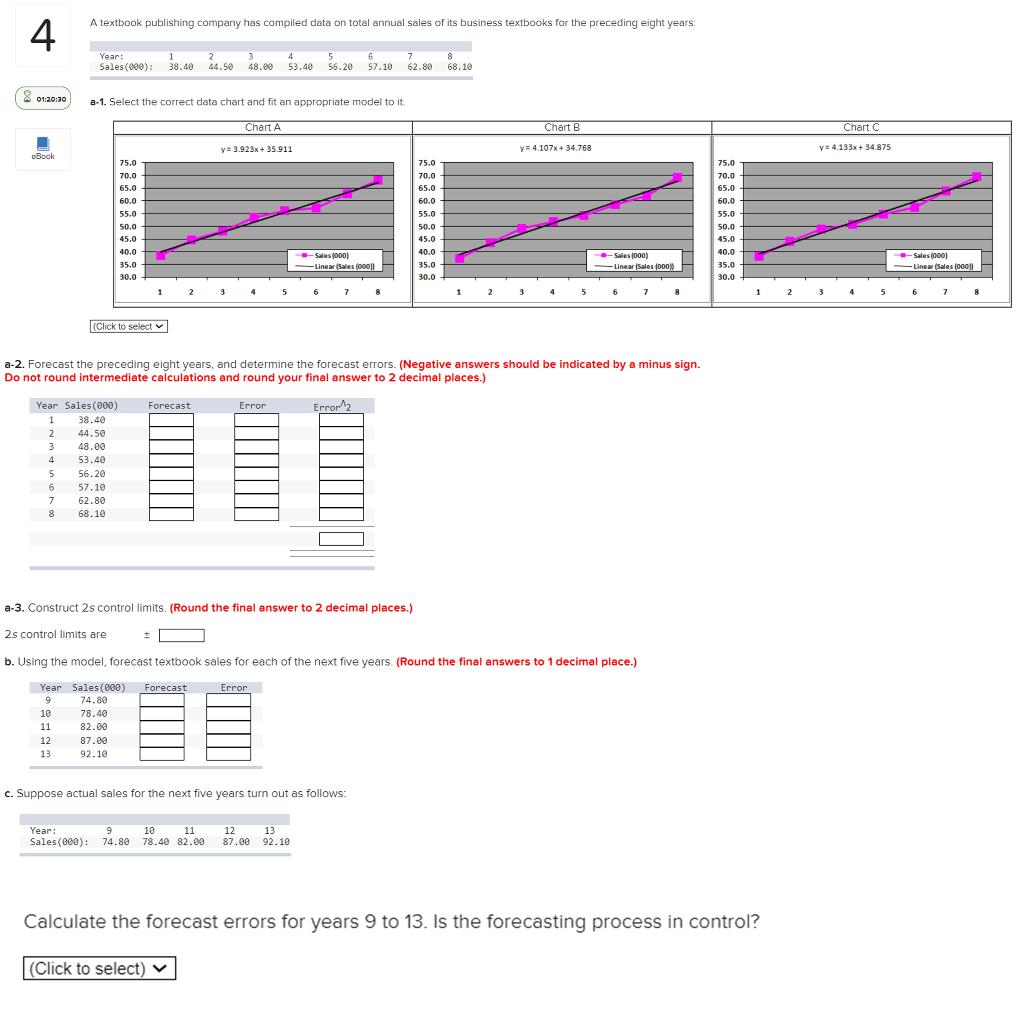
801:20:30 a-1. Select the correct data chart and fit an appropriate model to it a-2. Forecast the preceding eight years, and determine the forecast errors. (Negative answers should be indicated by a minus sign. Do not round intermediate calculations and round your final answer to 2 decimal places.) a-3. Construct 2 s control limits. (Round the final answer to 2 decimal places.) 2 control limits are \pm b. Using the model, forecast textbook sales for each of the next five years. (Round the final answers to 1 decimal place.) c. Suppose actual sales for the next five years turn out as follows: Calculate the forecast errors for years 9 to 13 . Is the forecasting process in control? 801:20:30 a-1. Select the correct data chart and fit an appropriate model to it a-2. Forecast the preceding eight years, and determine the forecast errors. (Negative answers should be indicated by a minus sign. Do not round intermediate calculations and round your final answer to 2 decimal places.) a-3. Construct 2 s control limits. (Round the final answer to 2 decimal places.) 2 control limits are \pm b. Using the model, forecast textbook sales for each of the next five years. (Round the final answers to 1 decimal place.) c. Suppose actual sales for the next five years turn out as follows: Calculate the forecast errors for years 9 to 13 . Is the forecasting process in control
Step by Step Solution
There are 3 Steps involved in it

Get step-by-step solutions from verified subject matter experts