

Question: 8:07 0 = VE > Lesson 2 Practice v The following graph shows the value of a car t years after purchase. Depreciated Value of
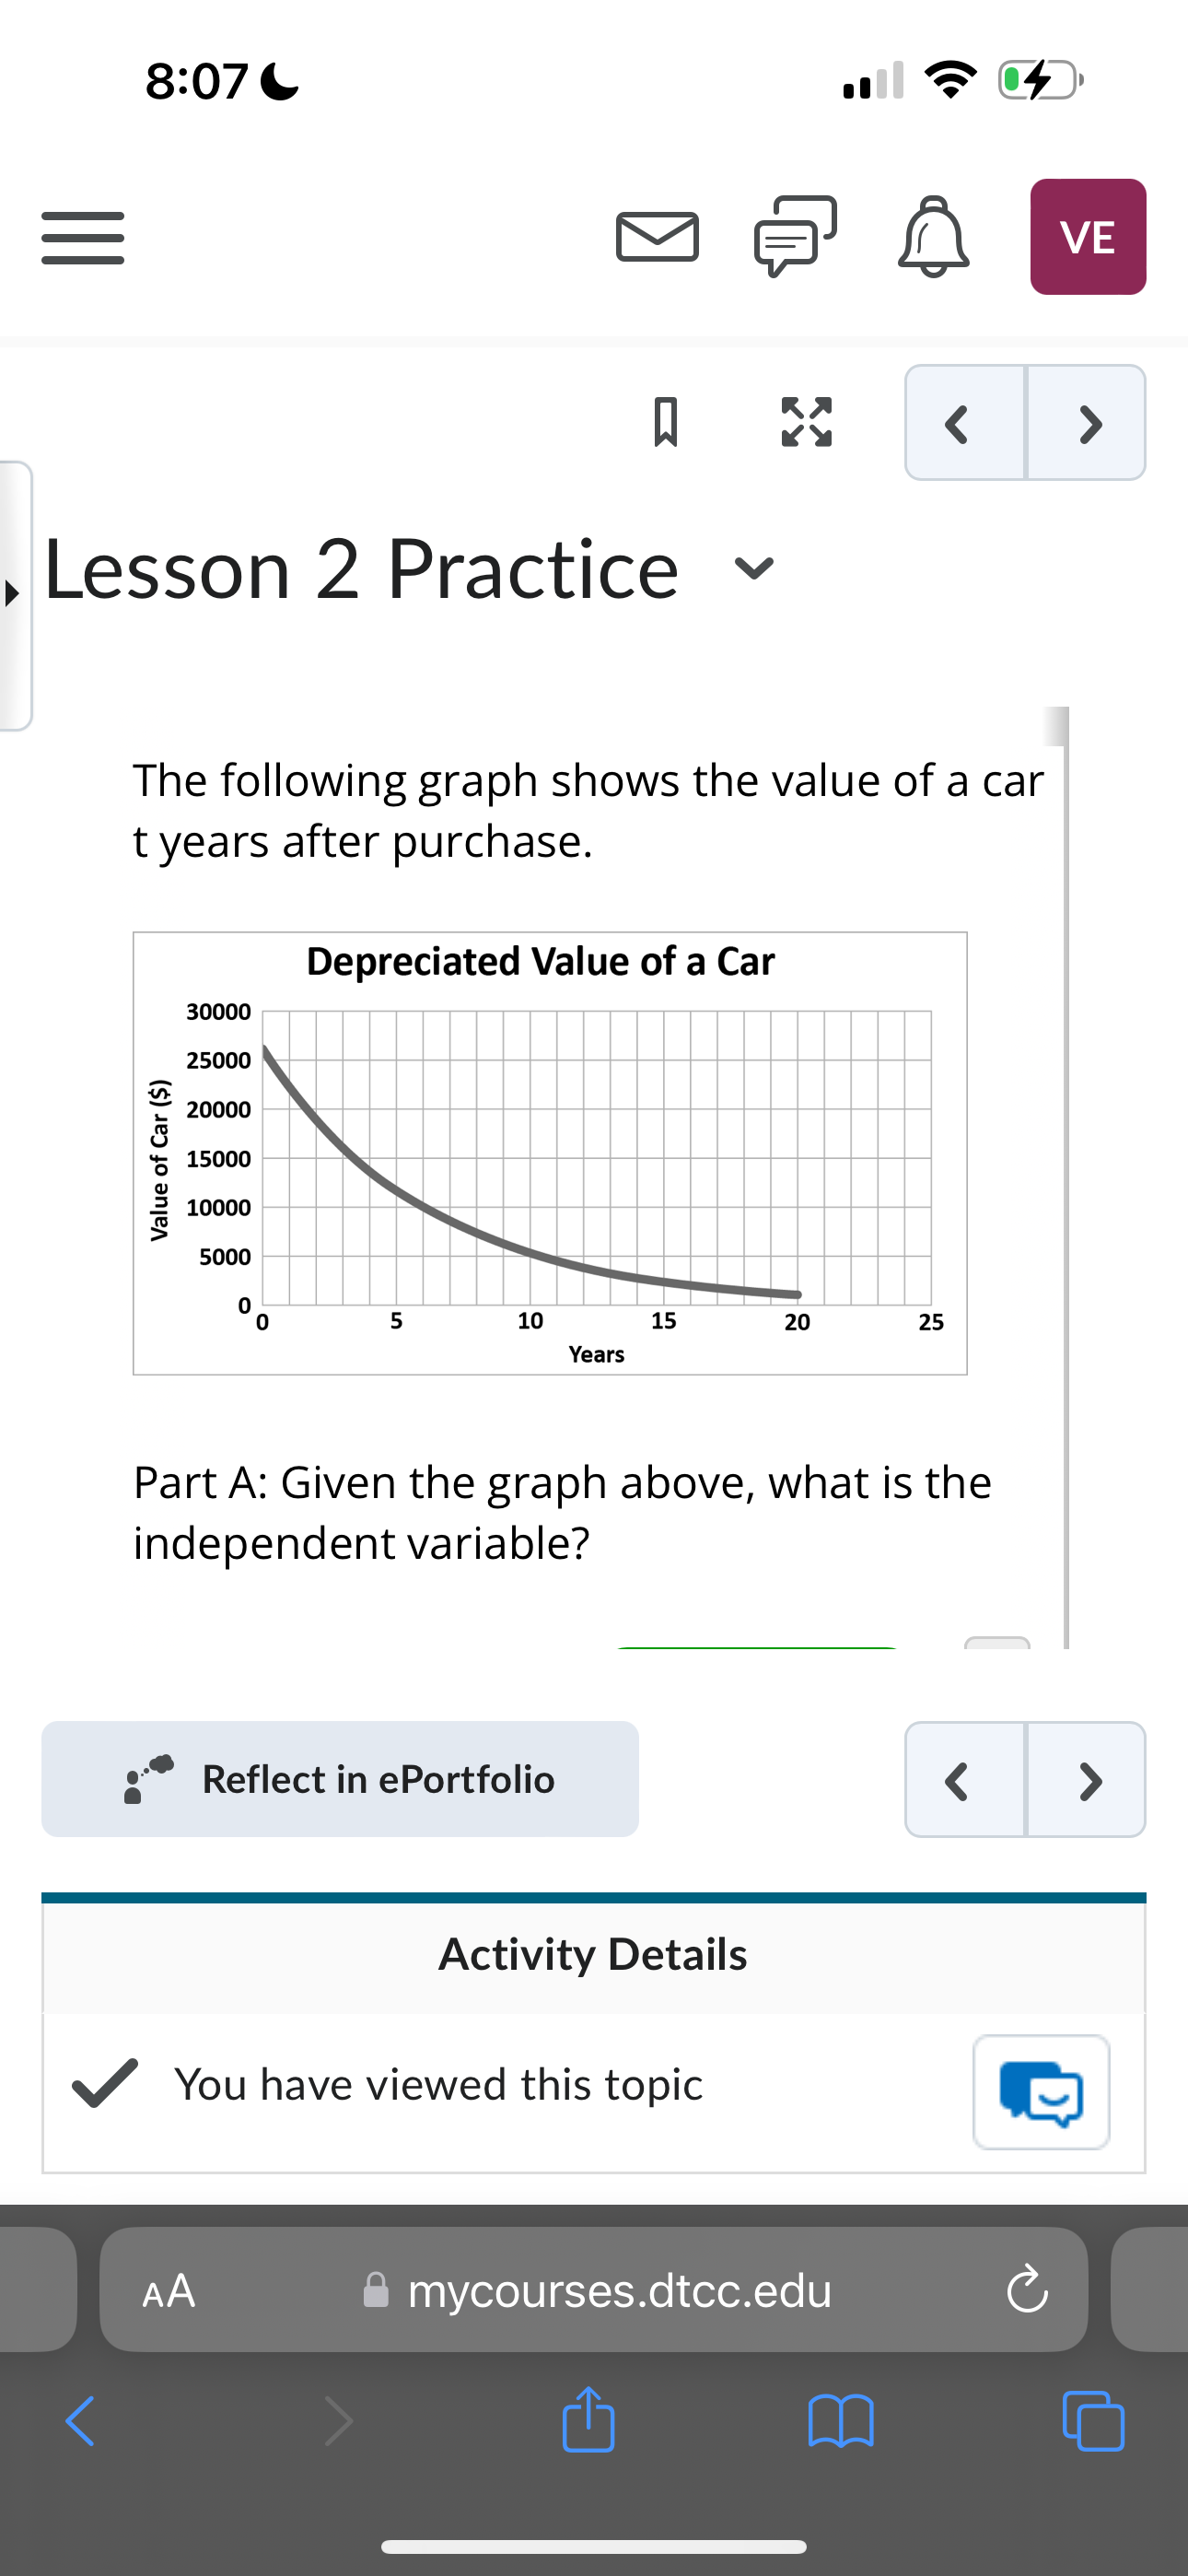
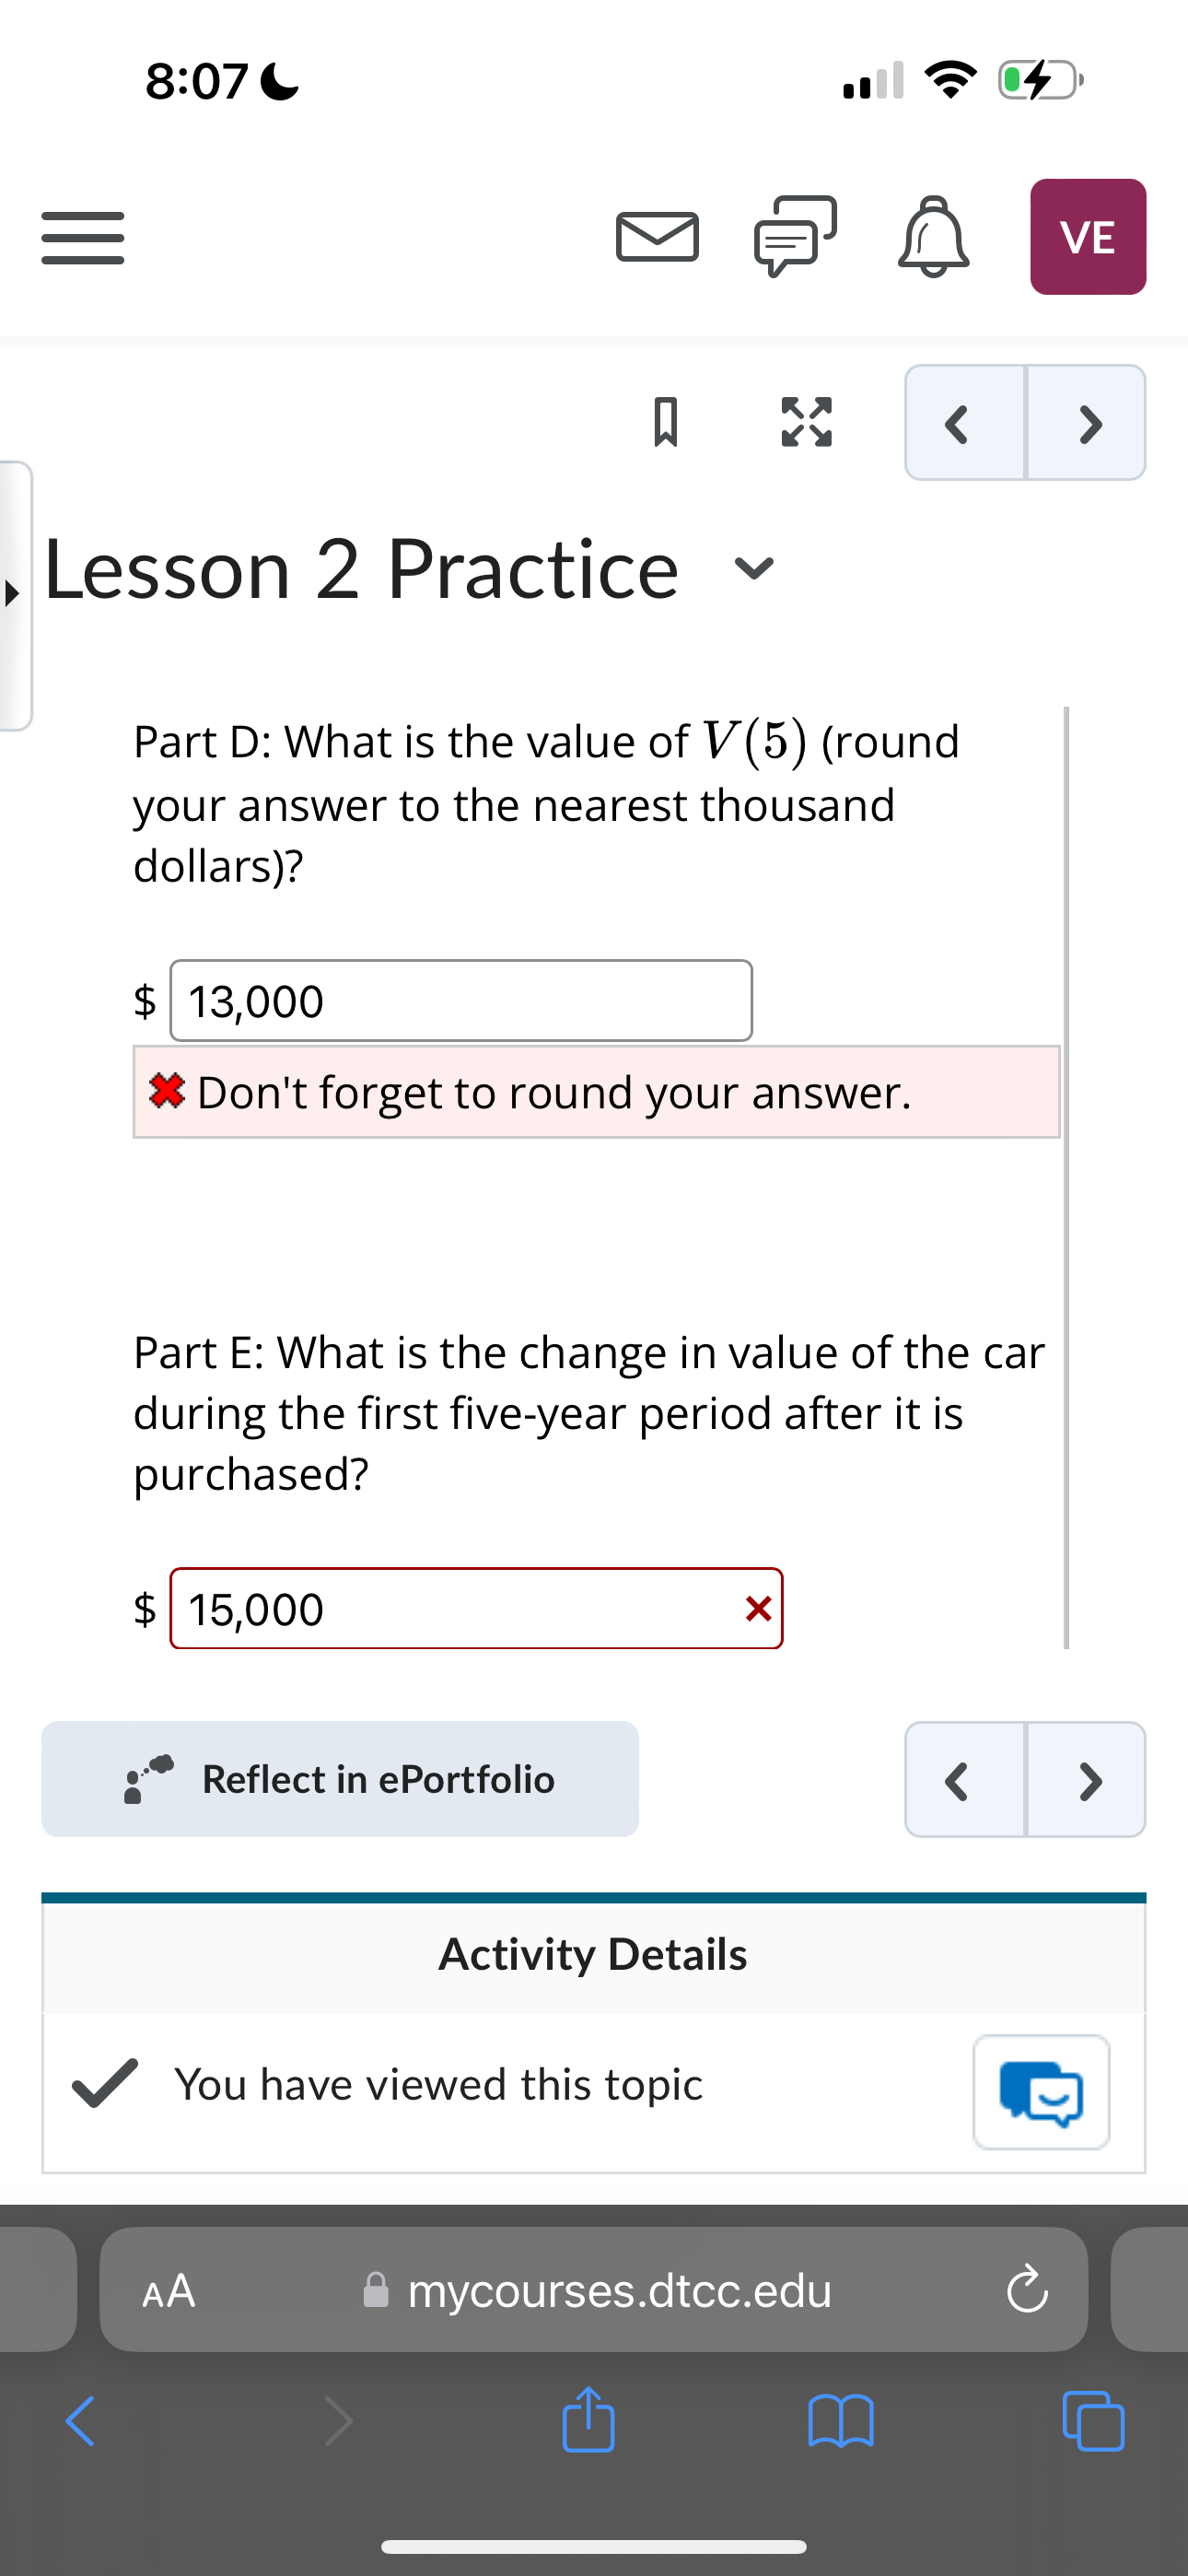
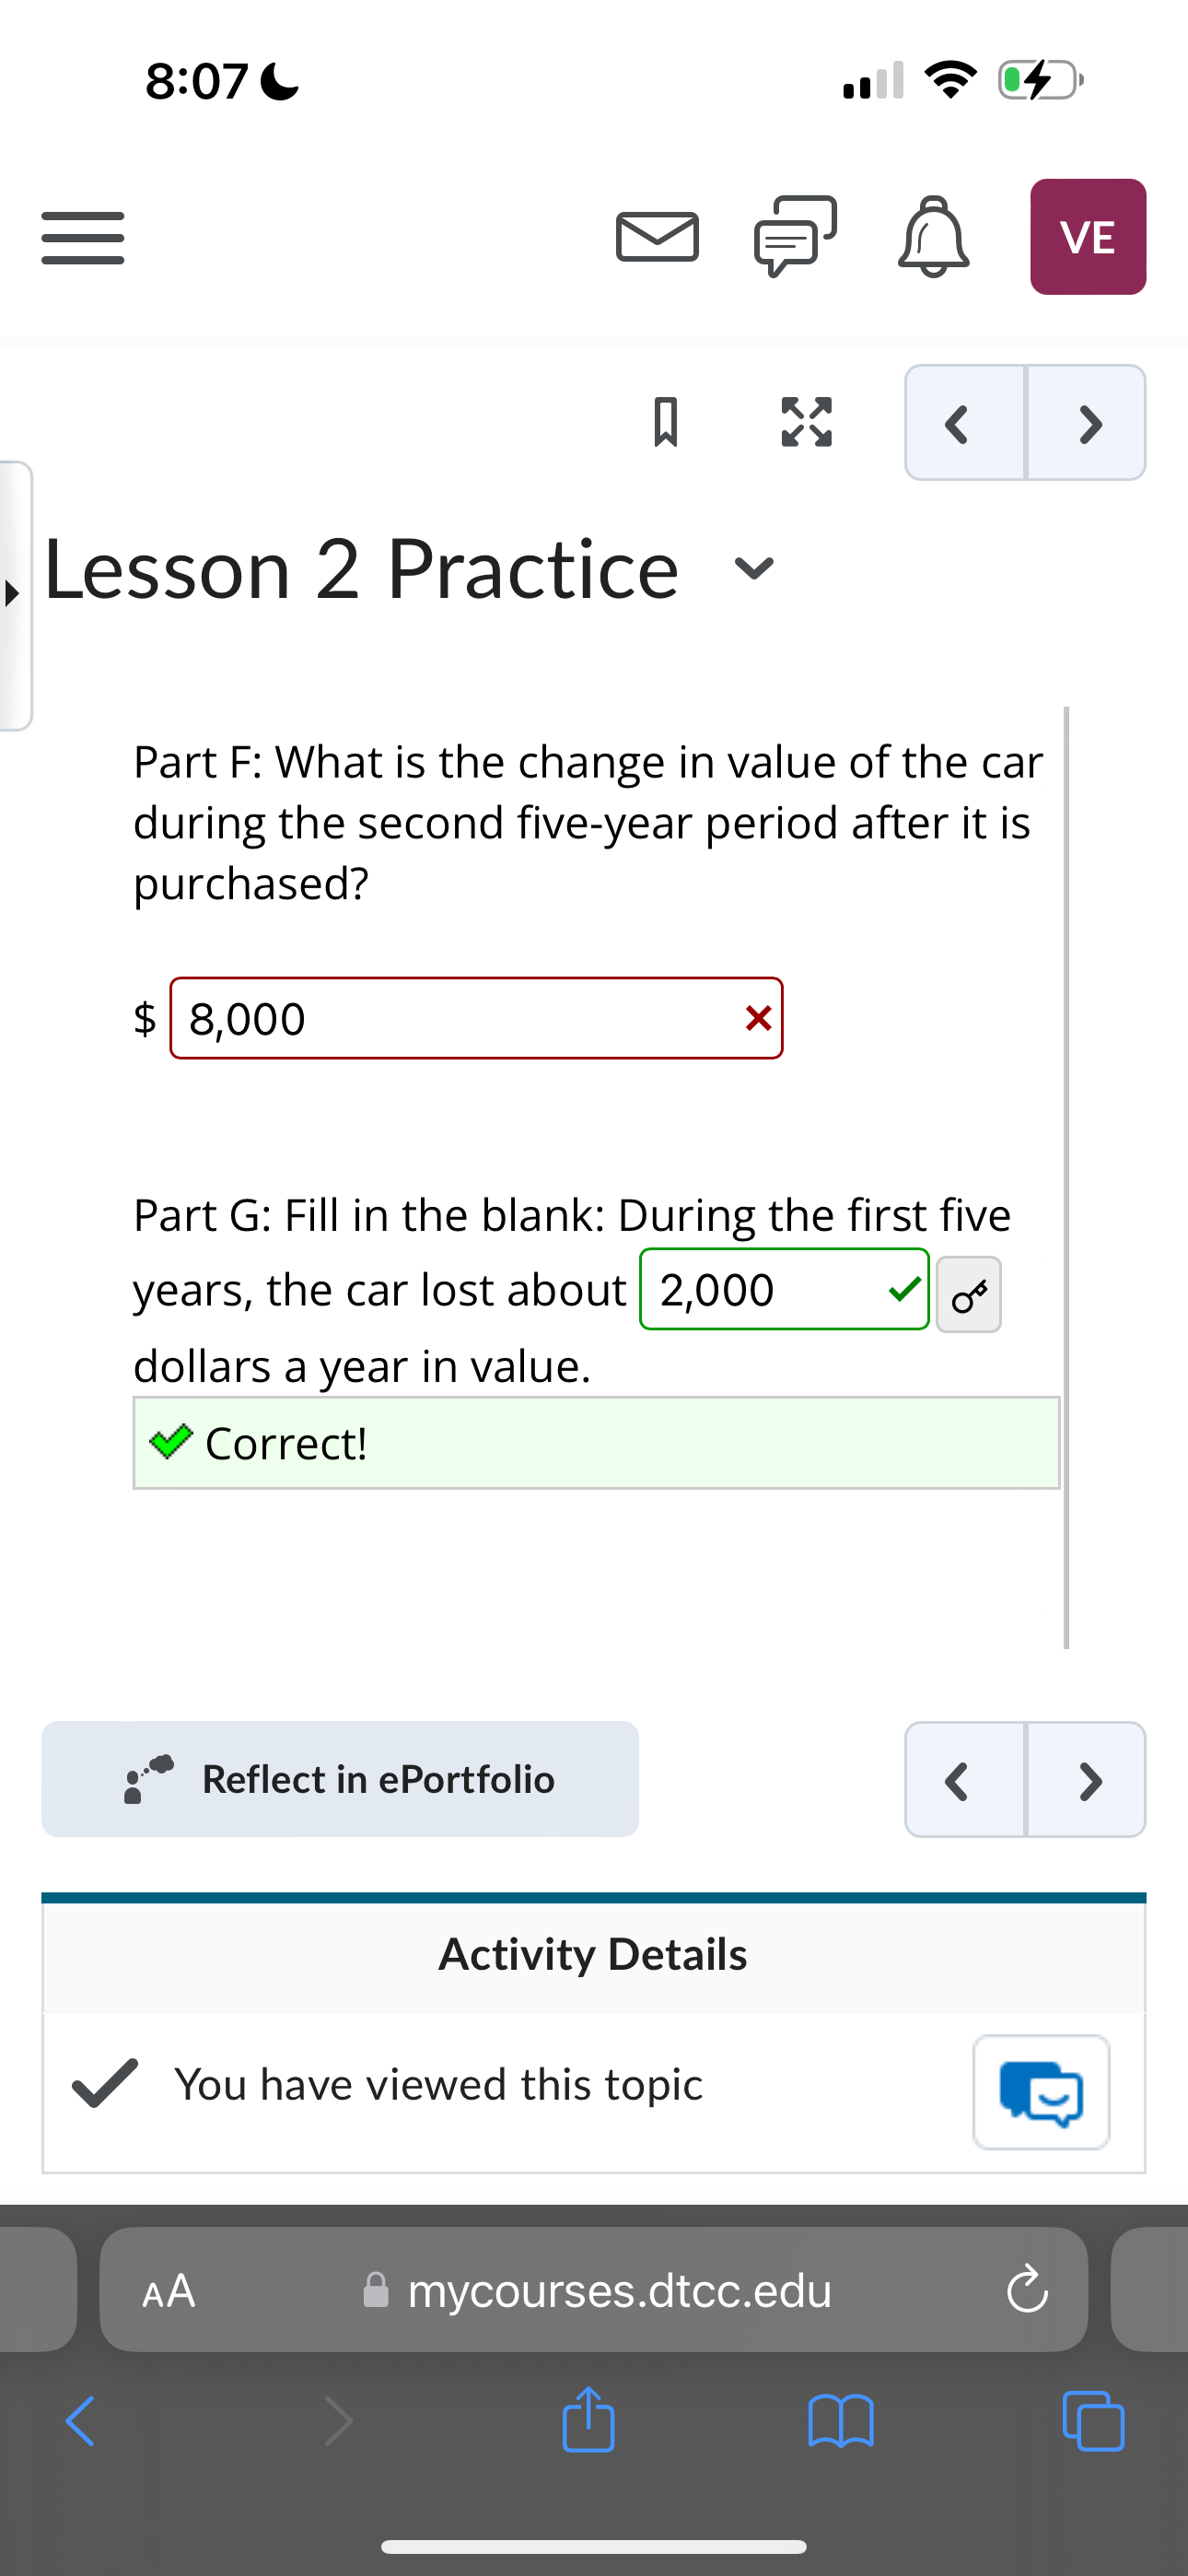
8:07 0 = VE > Lesson 2 Practice v The following graph shows the value of a car t years after purchase. Depreciated Value of a Car 30000 25000 20000 Value of Car ($) 15000 10000 5000 5 10 15 20 25 Years Part A: Given the graph above, what is the independent variable? Do Reflect in ePortfolio Activity Details V You have viewed this topic AA mycourses.dtcc.edu C m8:07 ull T 4 =& n 0 , Lesson 2 Practice v Part D: What is the value of V(5) (round your answer to the nearest thousand dollars)? $|13,000 # Don't forget to round your answer. Part E: What is the change in value of the car during the first five-year period after it is purchased? $115,000 X\\ ;"' Reflect in ePortfolio > Activity Details / You have viewed this topic E:] & mycourses.dtcc.edu 8:07 0 = VE Lesson 2 Practice v Part F: What is the change in value of the car during the second five-year period after it is purchased? 8,000 X Part G: Fill in the blank: During the first five years, the car lost about 2,000 dollars a year in value. Correct! Reflect in ePortfolio Activity Details V You have viewed this topic AA mycourses.dtcc.edu C m
Step by Step Solution
There are 3 Steps involved in it

Get step-by-step solutions from verified subject matter experts