

Question: 8.1) Create a one-way data table for profit at different levels f. supplier contact in range a. Ensure that the price in cell (C3) is
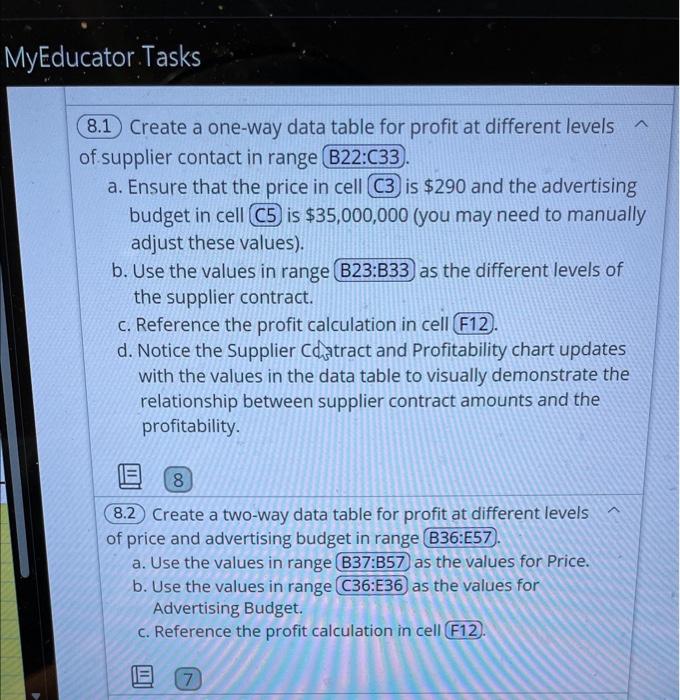
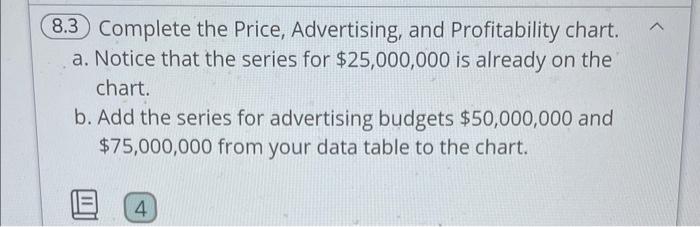
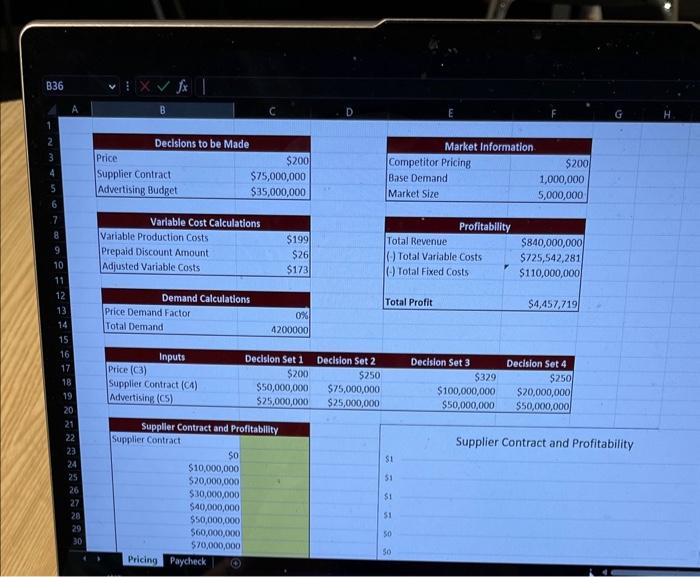
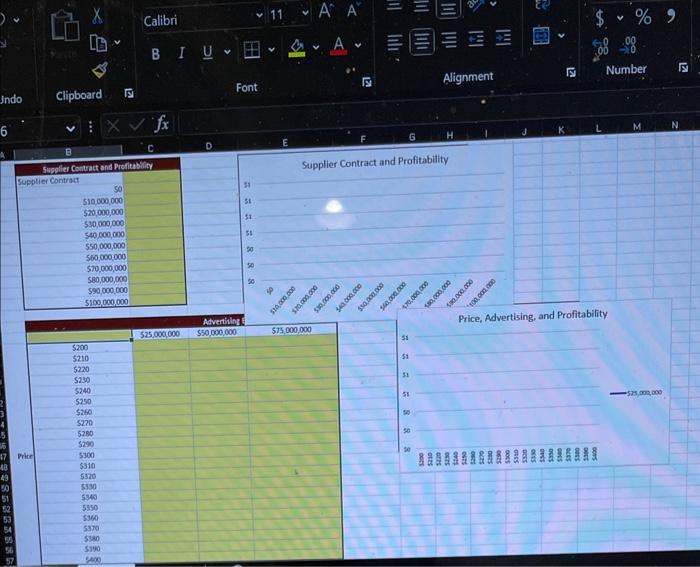
8.1) Create a one-way data table for profit at different levels f. supplier contact in range a. Ensure that the price in cell (C3) is $290 and the advertising budget in cell C5) is $35,000,000 (you may need to manually adjust these values). b. Use the values in range as the different levels of the supplier contract. c. Reference the profit calculation in cell d. Notice the Supplier Cdstract and Profitability chart updates with the values in the data table to visually demonstrate the relationship between supplier contract amounts and the profitability. 8.2) Create a two-way data table for profit at different levels of price and advertising budget in range a. Use the values in range as the values for Price. b. Use the values in range as the values for Advertising Budget. c. Reference the profit calculation in cell 8.3 Complete the Price, Advertising, and Profitability chart. a. Notice that the series for $25,000,000 is already on the chart. b. Add the series for advertising budgets $50,000,000 and $75,000,000 from your data table to the chart. Price, Advertising, and Profitability sin,0,000 8.1) Create a one-way data table for profit at different levels f. supplier contact in range a. Ensure that the price in cell (C3) is $290 and the advertising budget in cell C5) is $35,000,000 (you may need to manually adjust these values). b. Use the values in range as the different levels of the supplier contract. c. Reference the profit calculation in cell d. Notice the Supplier Cdstract and Profitability chart updates with the values in the data table to visually demonstrate the relationship between supplier contract amounts and the profitability. 8.2) Create a two-way data table for profit at different levels of price and advertising budget in range a. Use the values in range as the values for Price. b. Use the values in range as the values for Advertising Budget. c. Reference the profit calculation in cell 8.3 Complete the Price, Advertising, and Profitability chart. a. Notice that the series for $25,000,000 is already on the chart. b. Add the series for advertising budgets $50,000,000 and $75,000,000 from your data table to the chart. Price, Advertising, and Profitability sin,0,000
Step by Step Solution
There are 3 Steps involved in it

Get step-by-step solutions from verified subject matter experts