

Question: 81 Question 4. 82 Sample proportion p = 56/160 = 0.35 Note p is a point estimate for true proportion P 83 Sample n 160
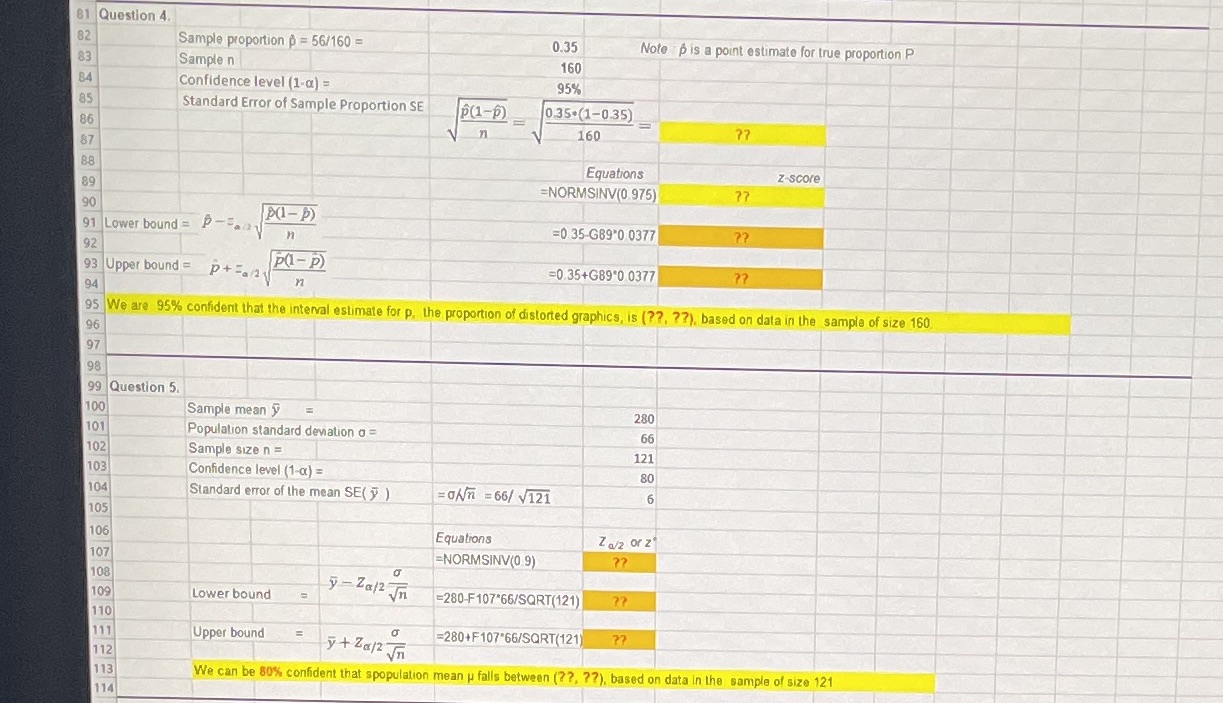
81 Question 4. 82 Sample proportion p = 56/160 = 0.35 Note p is a point estimate for true proportion P 83 Sample n 160 84 Confidence level (1-a) = 95%% 85 Standard Error of Sample Proportion SE p(1-p) 0.35.(1-0.35) 86 160 87 88 Equations z-score 89 =NORMSINV(0 975) ?? 90 P(I- P) 91 Lower bound = Pan n =0 35-G89 0 0377 ?? 92 93 Upper bound = p +=/2 p(1 - P) =0.35+G89*0 0377 ?? 94 95 We are 95% confident that the interval estimate for p. the proportion of distorted graphics, is (??, ??), based on data in the sample of size 160 96 97 98 99 Question 5. 100 Sample mean 280 101 Population standard deviation a= 66 102 Sample size n = 121 103 Confidence level (1-a) = 80 104 Standard error of the mean SE( ) ) =OAn =66/ V121 6 105 106 Equations Z a/2 or z' 107 =NORMSINV(0 9) ?? 108 109 Lower bound y - Za/2 Jn #280-F107 66/SQRT(121) 110 111 Upper bound E =280+F107 66/SQRT(121 77 112 y + Za/2 n 113 We can be 80%% confident that spopulation mean p falls between (??, ??), based on data in the sample of size 121 114
Step by Step Solution
There are 3 Steps involved in it

Get step-by-step solutions from verified subject matter experts