

Question: 8.13 The following density function describes the ran- dom variable X. % 0 8.13 The following density function describes the ran- dom variable X. a.

8.13 The following density function describes the ran- dom variable X. % 0
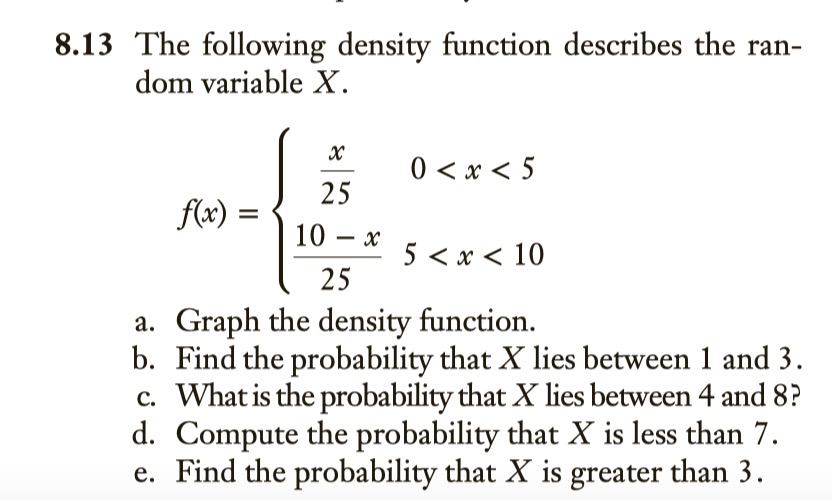
8.13 The following density function describes the ran- dom variable X. a. b. c. d. e. 25 10 -x 25 Graph the density function. Find the probability that X lies between 1 and 3. What is the probability that X lies between 4 and 8 ? Compute the probability that X is less than 7. Find the probability that X is greater than 3 .
Step by Step Solution
There are 3 Steps involved in it
1 Expert Approved Answer
Step: 1 Unlock

Question Has Been Solved by an Expert!
Get step-by-step solutions from verified subject matter experts
Step: 2 Unlock
Step: 3 Unlock