

Question: 8:35 X Project1ExcelWorkbook222... A Instructions 1. Bal. Sheet & Inc. Statement 2. Ratio Analysis 3. Common-size Analysis proposed version 01.12.2022 Project 1, Step 4: Instructions
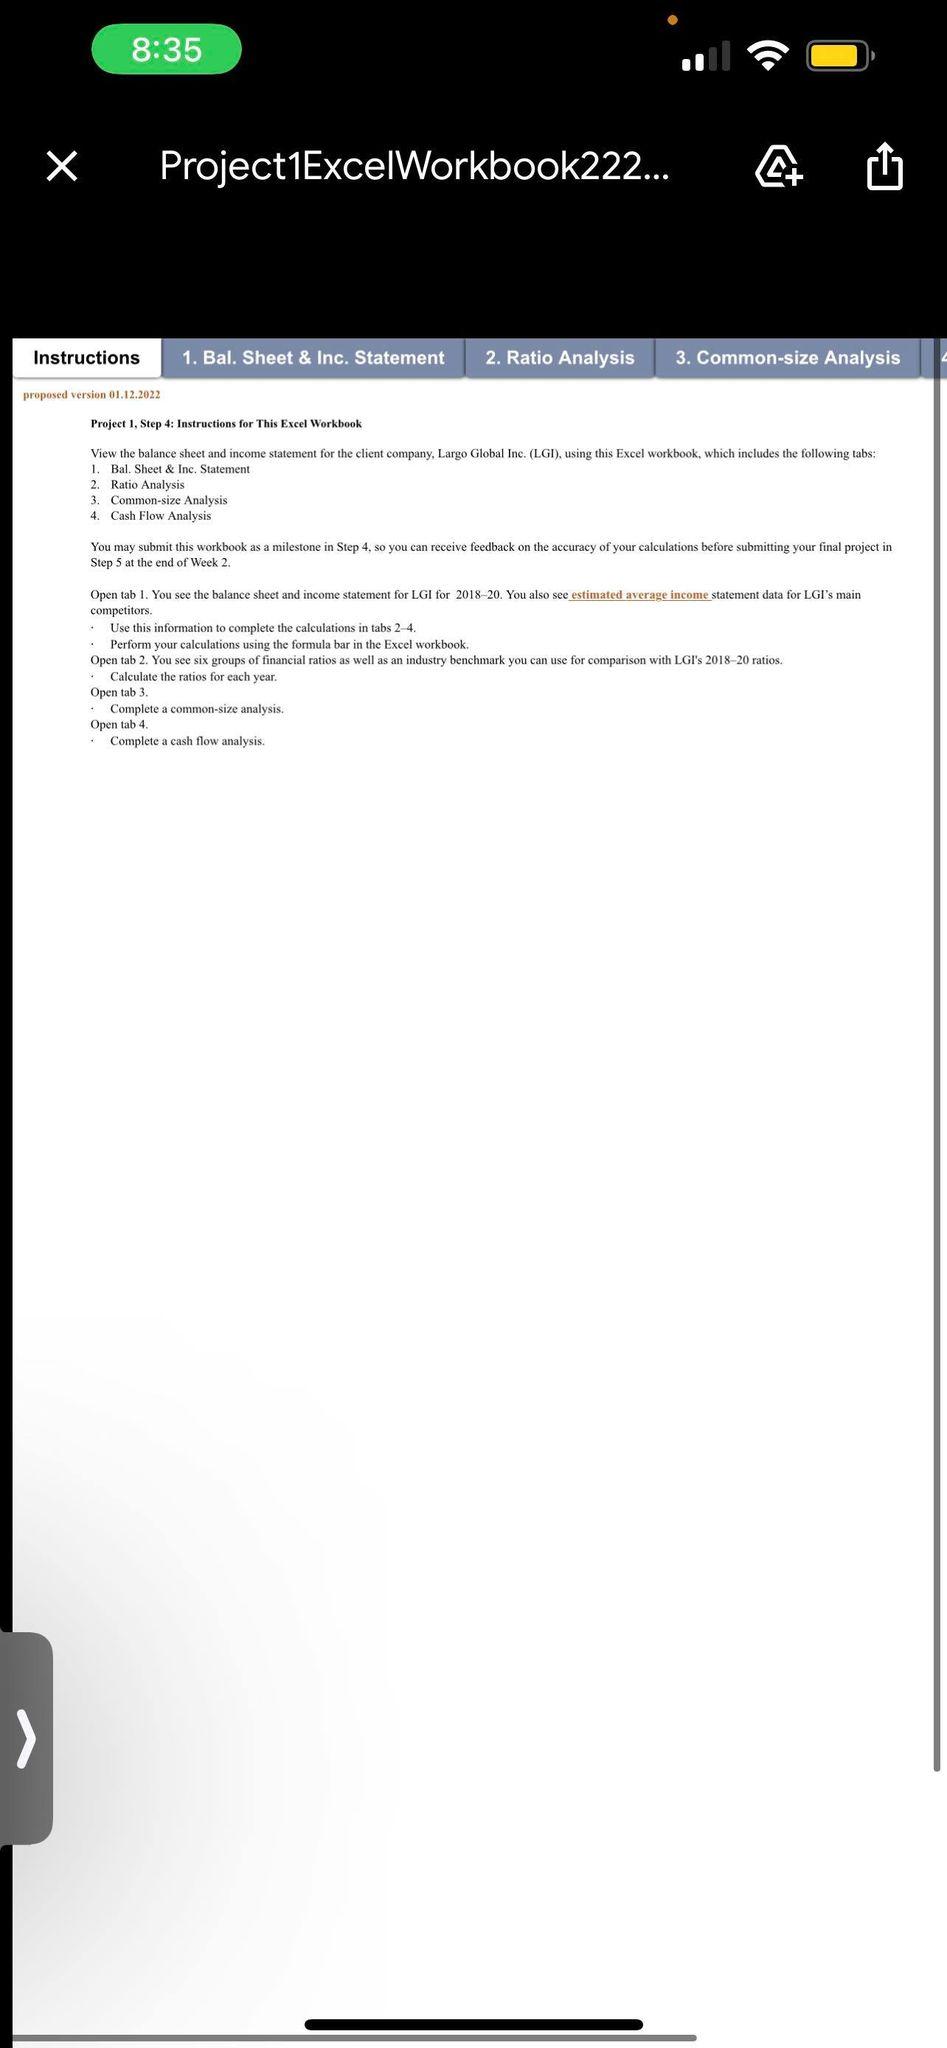
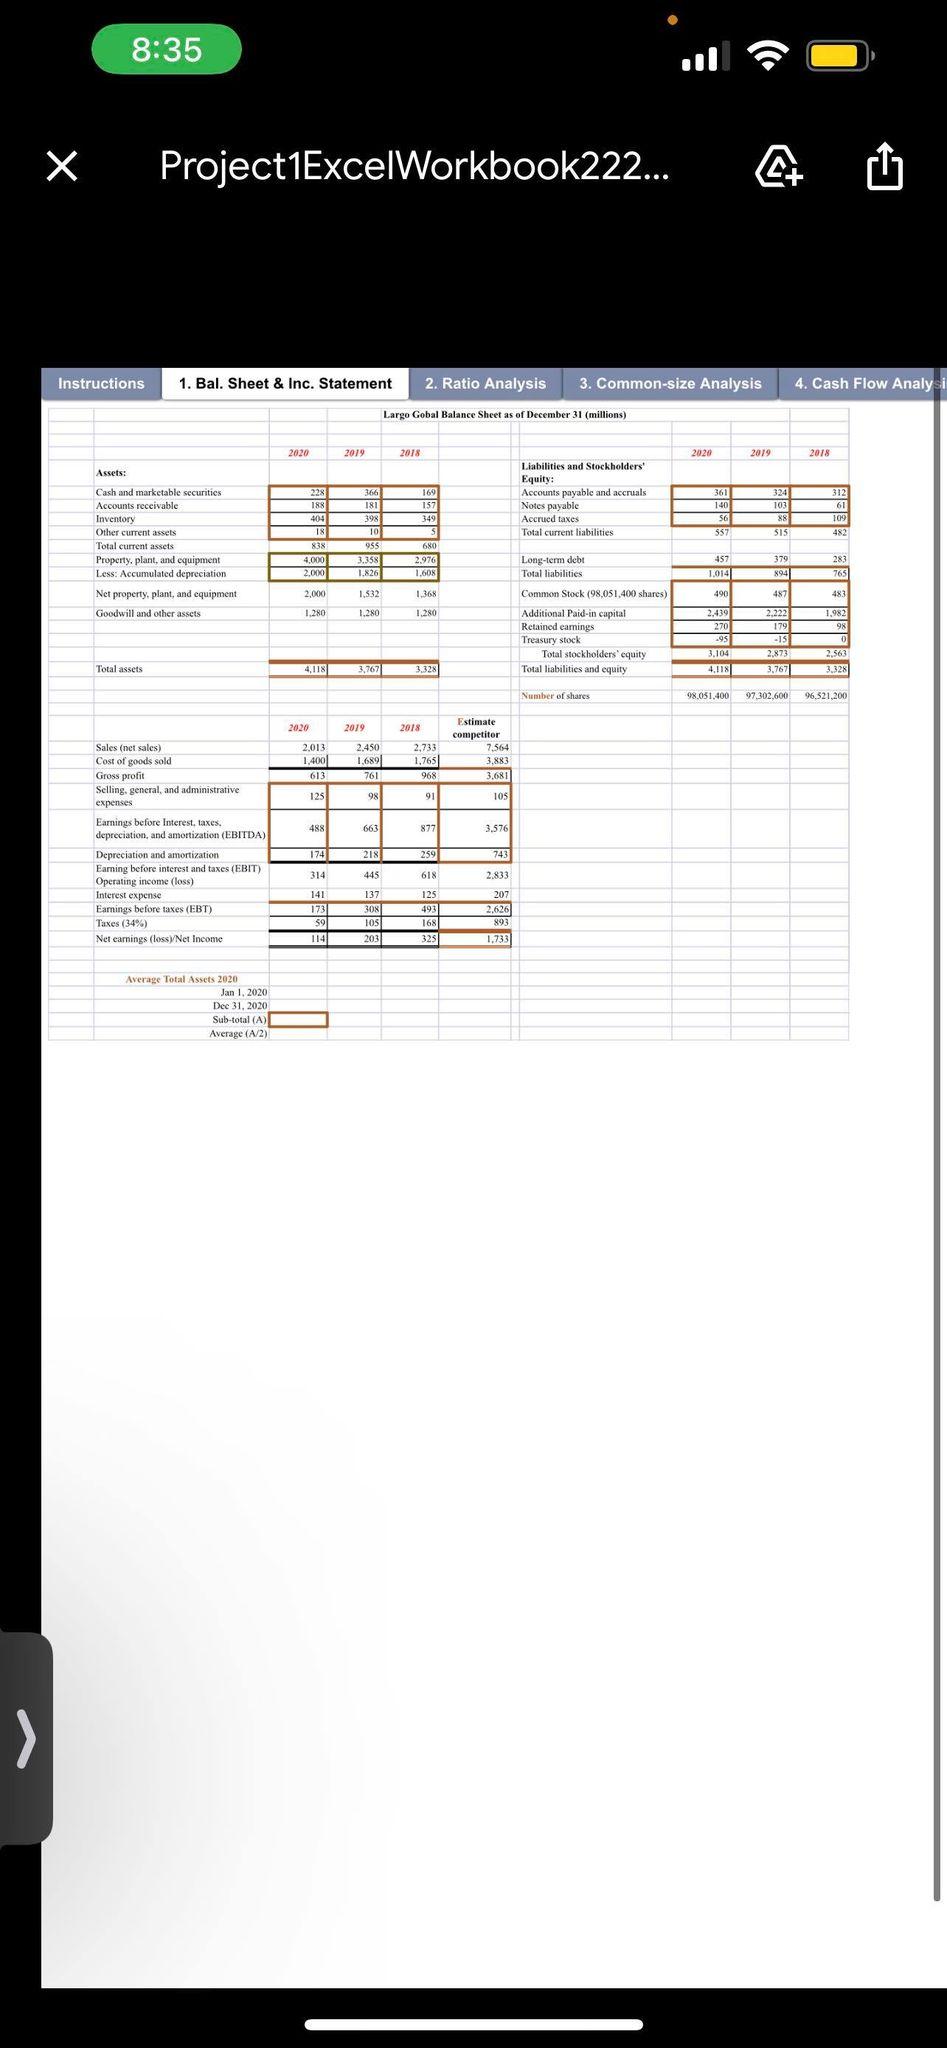
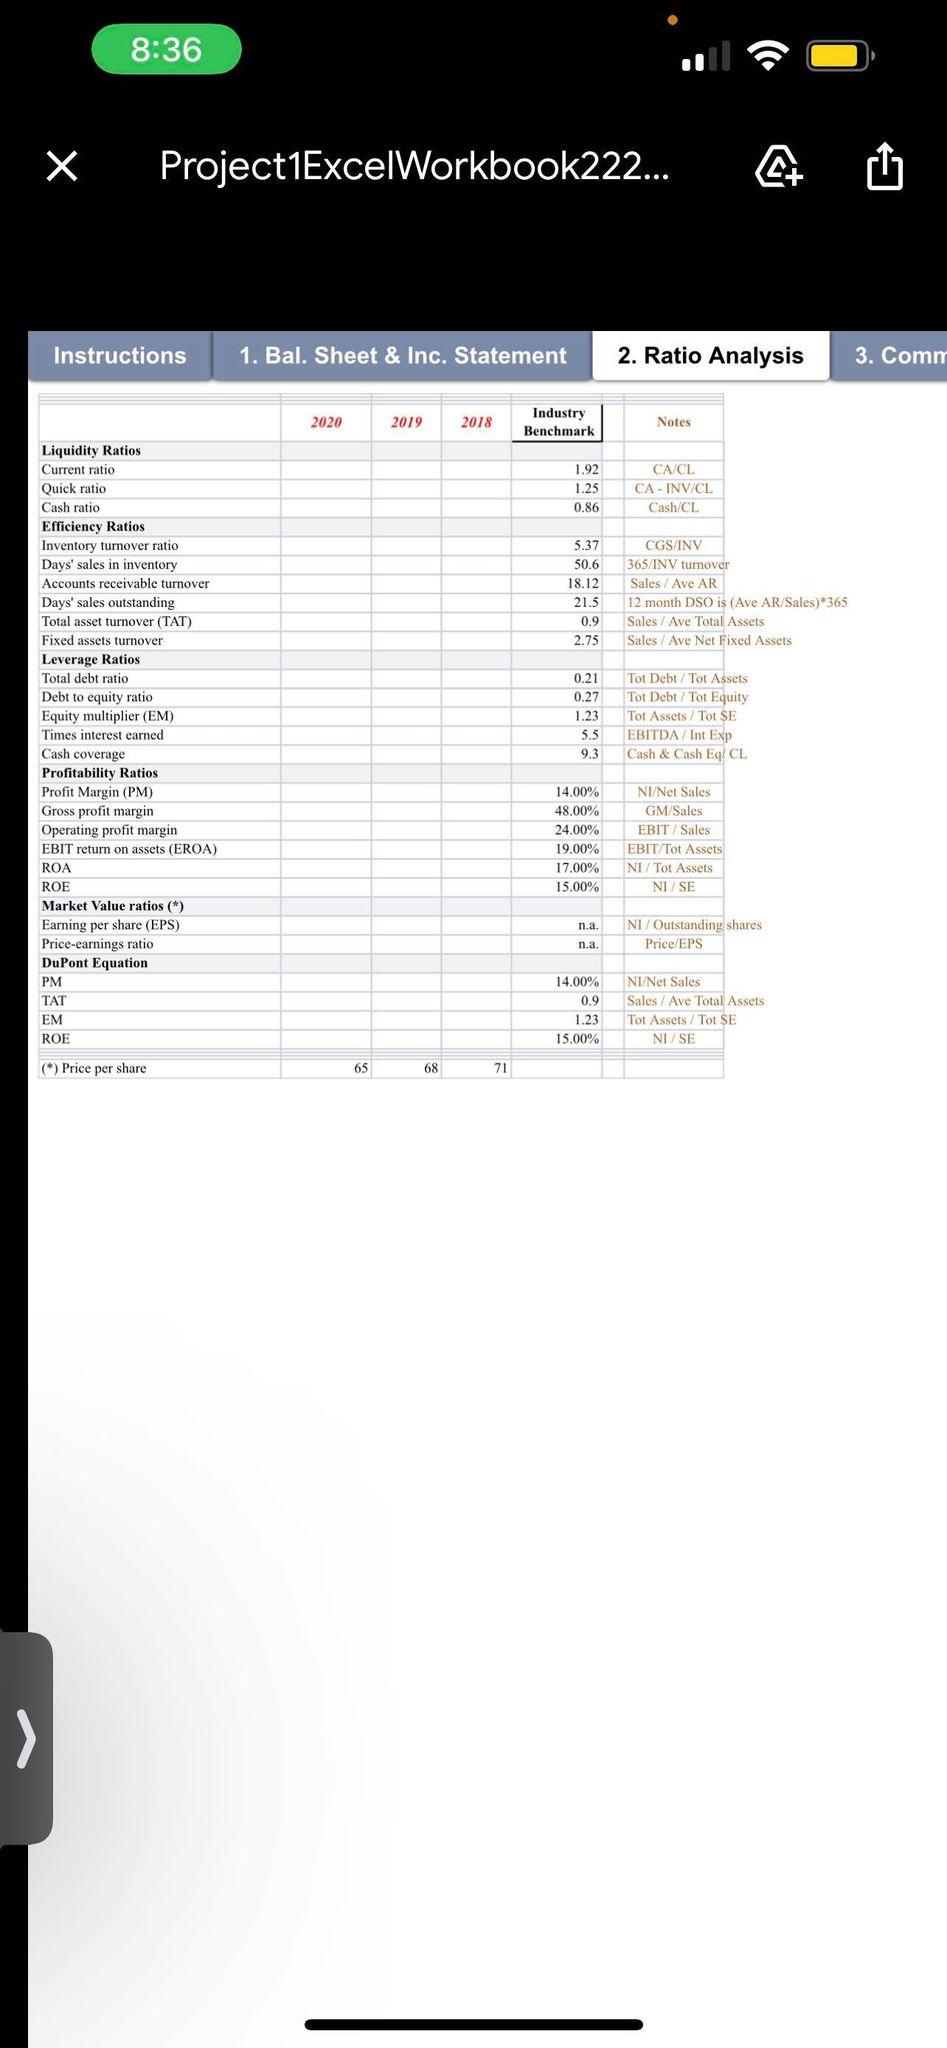
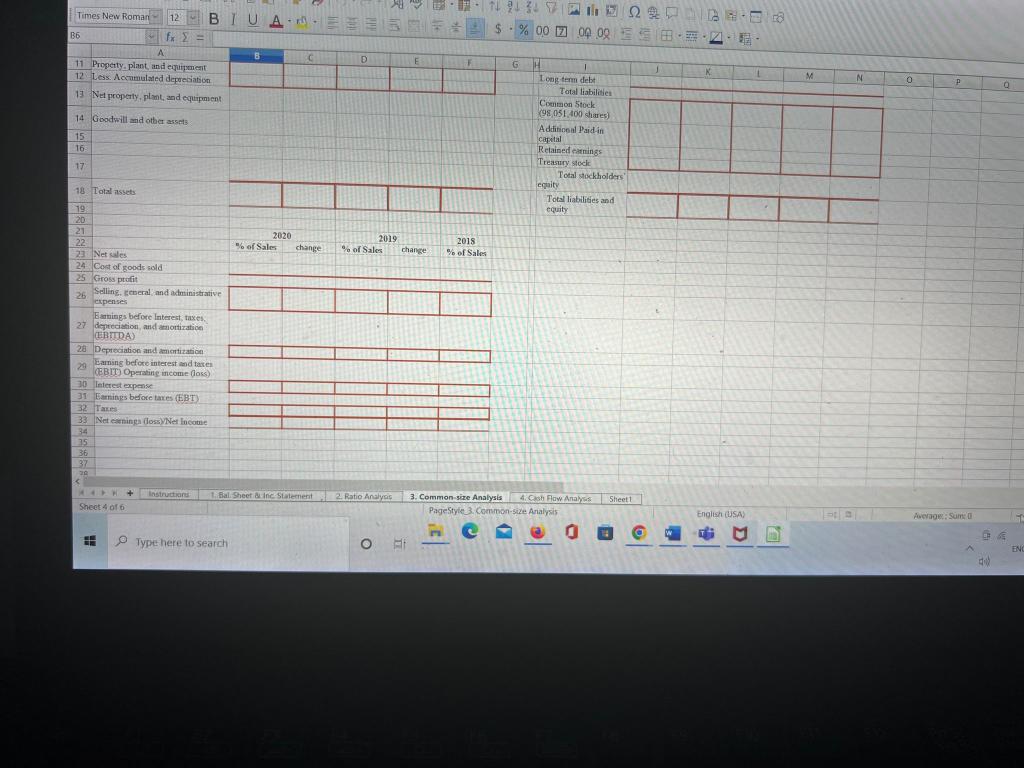
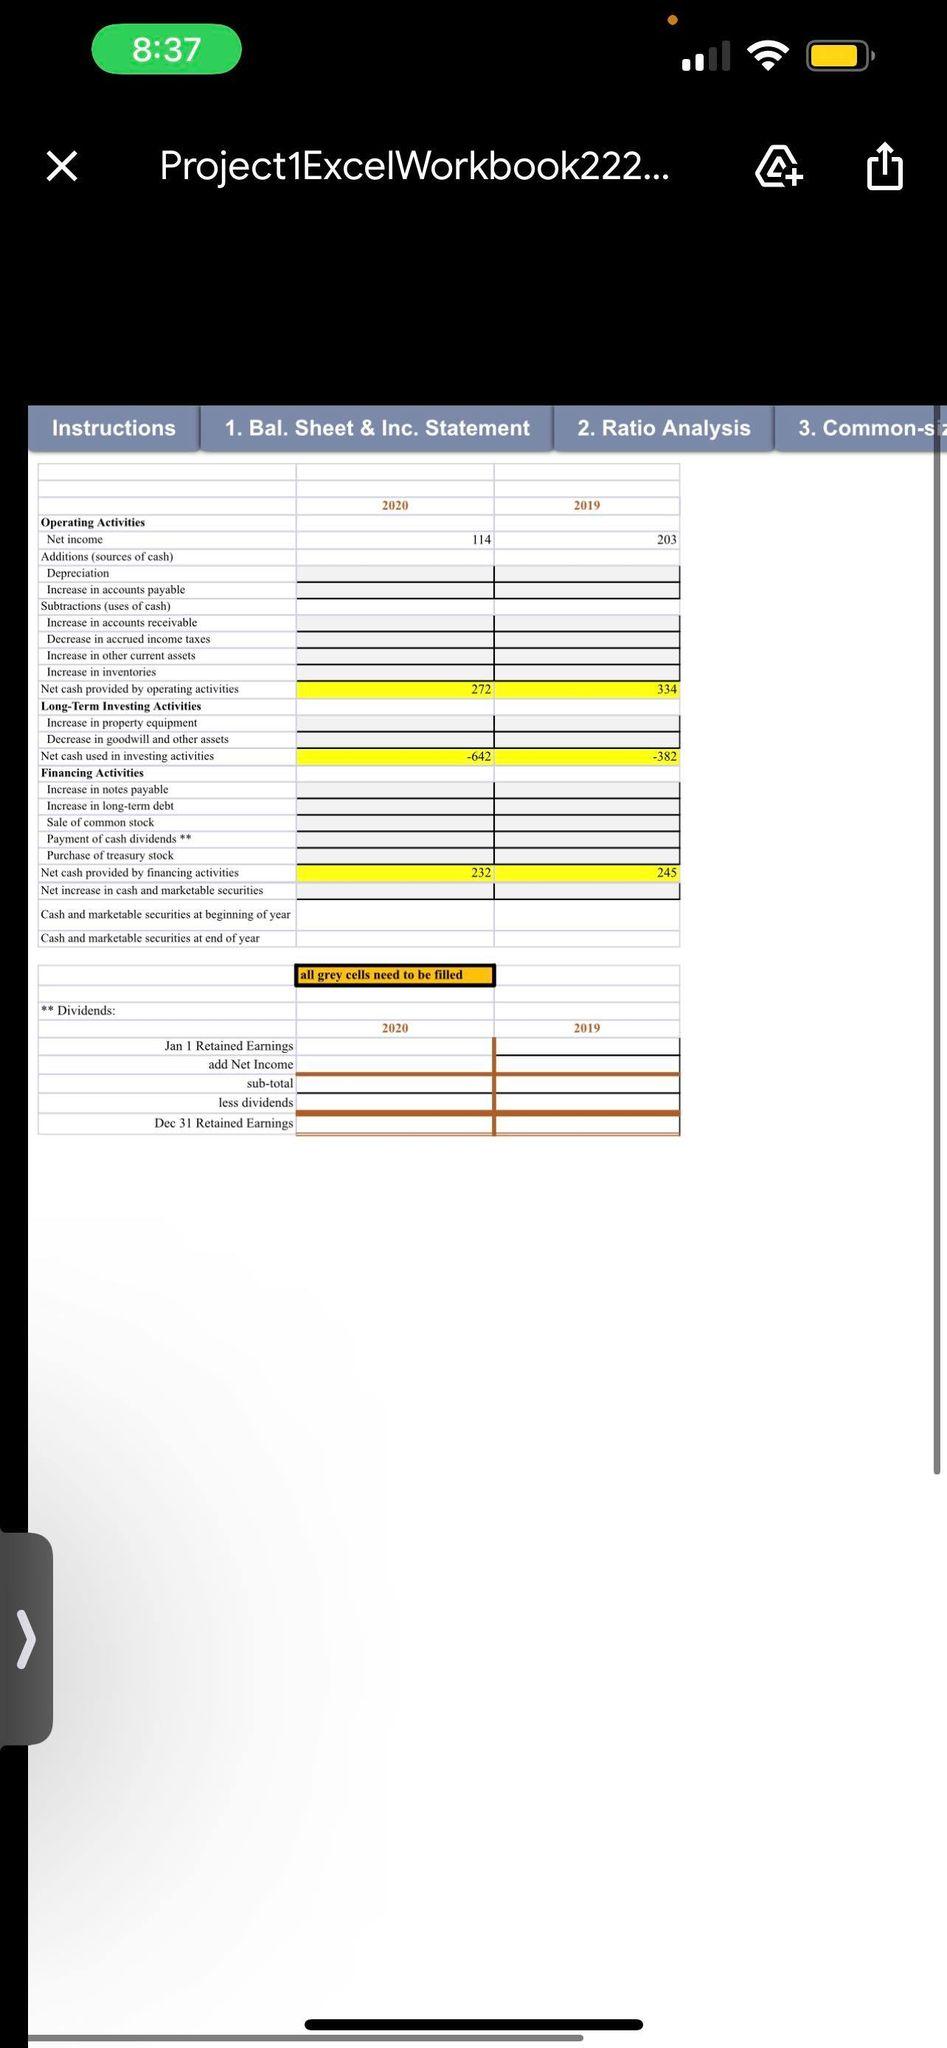
8:35 X Project1ExcelWorkbook222... A Instructions 1. Bal. Sheet & Inc. Statement 2. Ratio Analysis 3. Common-size Analysis proposed version 01.12.2022 Project 1, Step 4: Instructions for This Excel Workbook View the balance sheet and income statement for the client company, Largo Global Inc. (LGI), using this Excel workbook, which includes the following tabs: 1. Bal. Sheet & Inc. Statement 2. Ratio Analysis 3. Common-size Analysis 4. Cash Flow Analysis You may submit this workbook as a milestone in Step 4, so you can receive feedback on the accuracy of your calculations before submitting your final project in Step 5 at the end of Week 2. Open tab 1. You see the balance sheet and income statement for LGI for 2018-20. You also see estimated average income statement data for LGI's main competitors. Use this information to complete the calculations in tabs 2-4. Perform your calculations using the formula bar in the Excel workbook. Open tab 2. You see six groups of financial ratios as well as an industry benchmark you can use for comparison with LGI's 2018-20 ratios. Calculate the ratios for each year. Open tab 3. Complete a common-size analysis. Open tab 4 Complete a cash flow analysis. > 8:35 X Project1ExcelWorkbook222... A Instructions 1. Bal. Sheet & Inc. Statement 2. Ratio Analysis 3. Common-size Analysis 4. Cash Flow Analy Largo Gobal Balance Sheet as of December 31 (millions) 2020 2019 2018 2020 2019 2018 Assets: 169 15 349 228 188 404 18 838 4,000 2.000 Liabilities and Stockholders Equity: Accounts payable and accruals Notes payable Accrued taxes Total current liabilities 366 181 398 10 955 3.358 1.826 361 140 56 557 Cash and marketable securities Accounts receivable Inventory Other current assets Total current assets Property, plant, and equipment Less: Accumulated depreciation Net property, plant, and equipment Goodwill and other assets 324 103 88 515 312 61 109 482 680 2.976 1.608 457 1,014 379 894 283 765 2,000 1,532 1,368 490 483 1.280 1.280 1.280 Long-term debt Total liabilities Common Stock (98,051,400 shares) Additional Paid-in capital Retained earings Treasury stock Total stockholders' equity Total liabilities and equity 1,982 98 2.439 270 295 3.104 4.118 2.222 179 -T5 2.873 3,767 2,563 3.328 Total assets 4,118 3,767 3.328 Number of shares 98.051.400 97.302.600 96 521,200 2020 2019 2018 2,013 1.4001 613 2.450 1.689 761 2.733 1.765 968 Estimate competitor 7,564 3,883 3.681 125 98 91 488 663 877 3.576 Sales (net sales) Cost of goods sold Gross profit Selling, general, and administrative expenses Earnings before Interest, taxes. depreciation, and amortization (EBITDA) Depreciation and amortization Eaming before interest and taxes (EBIT) Operating income (loss) Interest expense Eamings before taxes (EBT) Taxes (34%) Net earnings (loss/Net Income 174 218 259 743 .833 141 173 137 308 105 203 125 493 168 325 207 2.626 893 114 1.733 Average Total Assets 2020 Jan 1, 2020 Dec 31, 2020 Sub-total (A) Average (A/2) > 8:36 X Project1ExcelWorkbook222... A U Instructions 1. Bal. Sheet & Inc. Statement 2. Ratio Analysis 3. Comn 2020 2019 2018 Industry Benchmark Notes 1.92 1.25 0.86 CA/CL CA - INV/CL Cash/CL 5.37 50.6 18.12 21.5 0.9 2.75 CGS/INV 365/INV turnover Sales / Ave AR 12 month DSO is (Ave AR/Sales) *365 Sales / Ave Total Assets Sales / Ave Net Fixed Assets Liquidity Ratios Current ratio Quick ratio Cash ratio Efficiency Ratios Inventory turnover ratio Days' sales in inventory Accounts receivable turnover Days' sales outstanding Total asset turnover (TAT) Fixed assets turnover Leverage Ratios Total debt ratio Debt to equity ratio Equity multiplier (EM) Times interest earned Cash coverage Profitability Ratios Profit Margin (PM) Gross profit margin Operating profit margin EBIT return on assets (EROA) ROA ROE Market Value ratios (*) Earning per share (EPS) Price-earnings ratio DuPont Equation PM TAT EM ROE 0.21 0.27 1.23 5.5 9.3 Tot Debt/Tot Assets Tot Debt / Tot Equity Tot Assets/Tot SE EBITDA / Int Exp Cash & Cash Eq/ CL 14.00% 48.00% 24.00% 19.00% 17.00% 15.00% NI/Net Sales GM/Sales EBIT/Sales EBIT/Tot Assets NI/Tot Assets NI / SE n.a. n.a. NI / Outstanding shares Price/EPS 14.00% 0.9 1.23 15.00% NI/Net Sales Sales/ Ave Total Assets Tot Assets/ Tot SE NI/SE (*) Price per share 65 68 71 > M N 0 P 0 TL 91 37 128 1 2 3 2 1lt Times New Roman 12 BIU AS$ % 00 00 00 S. $ B6 fx = A D E F G H 11 Property.plant and equipment 1 K 12 Les Accumulated depreciation Long term debt Total liabilities 13 Net property, plant and equipment Common Stock 98 051/400 shares) 14 Goodwill and other assets Additional Paid in capital 15 Retained earnings 16 Treasury stock 17 Total stockholders cquity 18 Total assets Total liabilities and equity 19 20 21 2020 2019 2018 22 % of Sales change % of Sales change % of Sales 23 Net sales 24 Cost of goods sold 25 Gross profit 26 Selling, oneral and administrative expenses Earnings before Interest, taxes 27 depreciation, and amortization CERTIDA 28 Depreciation and mortization 29 20 Earning before interest and taxes EBIT) Operating income oss) 30 tetest expense 31 Barnings before taxes (EBT) 32 Ta 33 Netinga dos Netlost Income 34 25 36 37 20 instruction 1. Bal. Sheet In Statement 2. Ratio Analysis 3. Common 3. Common size Analysis Analysis 4. Cash Flow AnalysSheet Sheet 4 of 6 Page Style Commons Analysis English (USA) Average: Sumed Type here to search Ft ENC 8:37 X Project1ExcelWorkbook222... A U Instructions 1. Bal. Sheet & Inc. Statement 2. Ratio Analysis 3. Commons 2020 2019 114 203 272 334 Operating Activities Net income Additions (sources of cash) Depreciation Increase in accounts payable Subtractions (uses of cash) Tom Increase in accounts receivable Decrease in accrued income taxes Increase in other current assets Increase in inventories Net cash provided by operating activities Long-Term Investing Activities Increase in property equipment Decrease in goodwill and other assets Net cash used in investing activities Financing Activities Increase in notes payable Increase in long-term debt Sale of common stock Payment of cash dividends ** Purchase of treasury stock Net cash provided by financing activities Net increase in cash and marketable securities -642 -382 232 245 Cash and marketable securities at beginning of year Cash and marketable securities at end of year all grey cells need to be filled ** Dividends: 2020 2019 Jan 1 Retained Earnings add Net Income sub-total less dividends Dec 31 Retained Earnings 8:35 X Project1ExcelWorkbook222... A Instructions 1. Bal. Sheet & Inc. Statement 2. Ratio Analysis 3. Common-size Analysis proposed version 01.12.2022 Project 1, Step 4: Instructions for This Excel Workbook View the balance sheet and income statement for the client company, Largo Global Inc. (LGI), using this Excel workbook, which includes the following tabs: 1. Bal. Sheet & Inc. Statement 2. Ratio Analysis 3. Common-size Analysis 4. Cash Flow Analysis You may submit this workbook as a milestone in Step 4, so you can receive feedback on the accuracy of your calculations before submitting your final project in Step 5 at the end of Week 2. Open tab 1. You see the balance sheet and income statement for LGI for 2018-20. You also see estimated average income statement data for LGI's main competitors. Use this information to complete the calculations in tabs 2-4. Perform your calculations using the formula bar in the Excel workbook. Open tab 2. You see six groups of financial ratios as well as an industry benchmark you can use for comparison with LGI's 2018-20 ratios. Calculate the ratios for each year. Open tab 3. Complete a common-size analysis. Open tab 4 Complete a cash flow analysis. > 8:35 X Project1ExcelWorkbook222... A Instructions 1. Bal. Sheet & Inc. Statement 2. Ratio Analysis 3. Common-size Analysis 4. Cash Flow Analy Largo Gobal Balance Sheet as of December 31 (millions) 2020 2019 2018 2020 2019 2018 Assets: 169 15 349 228 188 404 18 838 4,000 2.000 Liabilities and Stockholders Equity: Accounts payable and accruals Notes payable Accrued taxes Total current liabilities 366 181 398 10 955 3.358 1.826 361 140 56 557 Cash and marketable securities Accounts receivable Inventory Other current assets Total current assets Property, plant, and equipment Less: Accumulated depreciation Net property, plant, and equipment Goodwill and other assets 324 103 88 515 312 61 109 482 680 2.976 1.608 457 1,014 379 894 283 765 2,000 1,532 1,368 490 483 1.280 1.280 1.280 Long-term debt Total liabilities Common Stock (98,051,400 shares) Additional Paid-in capital Retained earings Treasury stock Total stockholders' equity Total liabilities and equity 1,982 98 2.439 270 295 3.104 4.118 2.222 179 -T5 2.873 3,767 2,563 3.328 Total assets 4,118 3,767 3.328 Number of shares 98.051.400 97.302.600 96 521,200 2020 2019 2018 2,013 1.4001 613 2.450 1.689 761 2.733 1.765 968 Estimate competitor 7,564 3,883 3.681 125 98 91 488 663 877 3.576 Sales (net sales) Cost of goods sold Gross profit Selling, general, and administrative expenses Earnings before Interest, taxes. depreciation, and amortization (EBITDA) Depreciation and amortization Eaming before interest and taxes (EBIT) Operating income (loss) Interest expense Eamings before taxes (EBT) Taxes (34%) Net earnings (loss/Net Income 174 218 259 743 .833 141 173 137 308 105 203 125 493 168 325 207 2.626 893 114 1.733 Average Total Assets 2020 Jan 1, 2020 Dec 31, 2020 Sub-total (A) Average (A/2) > 8:36 X Project1ExcelWorkbook222... A U Instructions 1. Bal. Sheet & Inc. Statement 2. Ratio Analysis 3. Comn 2020 2019 2018 Industry Benchmark Notes 1.92 1.25 0.86 CA/CL CA - INV/CL Cash/CL 5.37 50.6 18.12 21.5 0.9 2.75 CGS/INV 365/INV turnover Sales / Ave AR 12 month DSO is (Ave AR/Sales) *365 Sales / Ave Total Assets Sales / Ave Net Fixed Assets Liquidity Ratios Current ratio Quick ratio Cash ratio Efficiency Ratios Inventory turnover ratio Days' sales in inventory Accounts receivable turnover Days' sales outstanding Total asset turnover (TAT) Fixed assets turnover Leverage Ratios Total debt ratio Debt to equity ratio Equity multiplier (EM) Times interest earned Cash coverage Profitability Ratios Profit Margin (PM) Gross profit margin Operating profit margin EBIT return on assets (EROA) ROA ROE Market Value ratios (*) Earning per share (EPS) Price-earnings ratio DuPont Equation PM TAT EM ROE 0.21 0.27 1.23 5.5 9.3 Tot Debt/Tot Assets Tot Debt / Tot Equity Tot Assets/Tot SE EBITDA / Int Exp Cash & Cash Eq/ CL 14.00% 48.00% 24.00% 19.00% 17.00% 15.00% NI/Net Sales GM/Sales EBIT/Sales EBIT/Tot Assets NI/Tot Assets NI / SE n.a. n.a. NI / Outstanding shares Price/EPS 14.00% 0.9 1.23 15.00% NI/Net Sales Sales/ Ave Total Assets Tot Assets/ Tot SE NI/SE (*) Price per share 65 68 71 > M N 0 P 0 TL 91 37 128 1 2 3 2 1lt Times New Roman 12 BIU AS$ % 00 00 00 S. $ B6 fx = A D E F G H 11 Property.plant and equipment 1 K 12 Les Accumulated depreciation Long term debt Total liabilities 13 Net property, plant and equipment Common Stock 98 051/400 shares) 14 Goodwill and other assets Additional Paid in capital 15 Retained earnings 16 Treasury stock 17 Total stockholders cquity 18 Total assets Total liabilities and equity 19 20 21 2020 2019 2018 22 % of Sales change % of Sales change % of Sales 23 Net sales 24 Cost of goods sold 25 Gross profit 26 Selling, oneral and administrative expenses Earnings before Interest, taxes 27 depreciation, and amortization CERTIDA 28 Depreciation and mortization 29 20 Earning before interest and taxes EBIT) Operating income oss) 30 tetest expense 31 Barnings before taxes (EBT) 32 Ta 33 Netinga dos Netlost Income 34 25 36 37 20 instruction 1. Bal. Sheet In Statement 2. Ratio Analysis 3. Common 3. Common size Analysis Analysis 4. Cash Flow AnalysSheet Sheet 4 of 6 Page Style Commons Analysis English (USA) Average: Sumed Type here to search Ft ENC 8:37 X Project1ExcelWorkbook222... A U Instructions 1. Bal. Sheet & Inc. Statement 2. Ratio Analysis 3. Commons 2020 2019 114 203 272 334 Operating Activities Net income Additions (sources of cash) Depreciation Increase in accounts payable Subtractions (uses of cash) Tom Increase in accounts receivable Decrease in accrued income taxes Increase in other current assets Increase in inventories Net cash provided by operating activities Long-Term Investing Activities Increase in property equipment Decrease in goodwill and other assets Net cash used in investing activities Financing Activities Increase in notes payable Increase in long-term debt Sale of common stock Payment of cash dividends ** Purchase of treasury stock Net cash provided by financing activities Net increase in cash and marketable securities -642 -382 232 245 Cash and marketable securities at beginning of year Cash and marketable securities at end of year all grey cells need to be filled ** Dividends: 2020 2019 Jan 1 Retained Earnings add Net Income sub-total less dividends Dec 31 Retained Earnings
Step by Step Solution
There are 3 Steps involved in it

Get step-by-step solutions from verified subject matter experts