

Question: 89) Following are selected data from the comparative income statement and bal Owens Corporation for the years ended December 31, 2014, and 2013: Selected Data
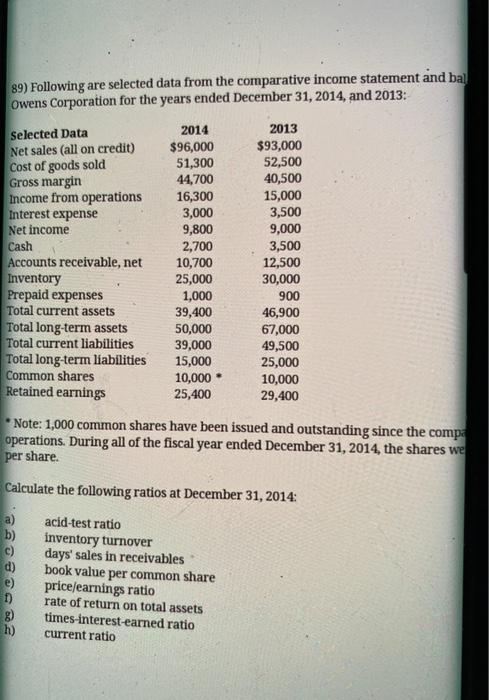
89) Following are selected data from the comparative income statement and bal Owens Corporation for the years ended December 31, 2014, and 2013: Selected Data Net sales (all on credit) Cost of goods sold Gross margin Income from operations Interest expense Net income Cash Accounts receivable, net Inventory Prepaid expenses Total current assets Total long-term assets Total current liabilities Total long-term liabilities Common shares Retained earnings 2014 $96,000 51,300 44,700 16,300 3,000 9,800 2,700 10,700 25,000 1,000 39,400 50,000 39,000 15,000 10,000 25,400 2013 $93,000 52,500 40,500 15,000 3,500 9,000 3,500 12,500 30,000 900 46,900 67,000 49,500 25,000 10,000 29,400 * Note: 1,000 common shares have been issued and outstanding since the compa operations. During all of the fiscal year ended December 31, 2014, the shares we per share. Calculate the following ratios at December 31, 2014: a) acid-test ratio b) inventory turnover c) days' sales in receivables d) book value per common share price/earnings ratio 1) rate of return on total assets times-interest earned ratio h) current ratio e)
Step by Step Solution
There are 3 Steps involved in it

Get step-by-step solutions from verified subject matter experts