Question: 8Question about Valuation and Security Analysis, calculation should be done in excel with detailed steps. MeMarket Co. is a large European supermarket chain. Fiscal year
8Question about Valuation and Security Analysis, calculation should be done in excel with detailed steps.
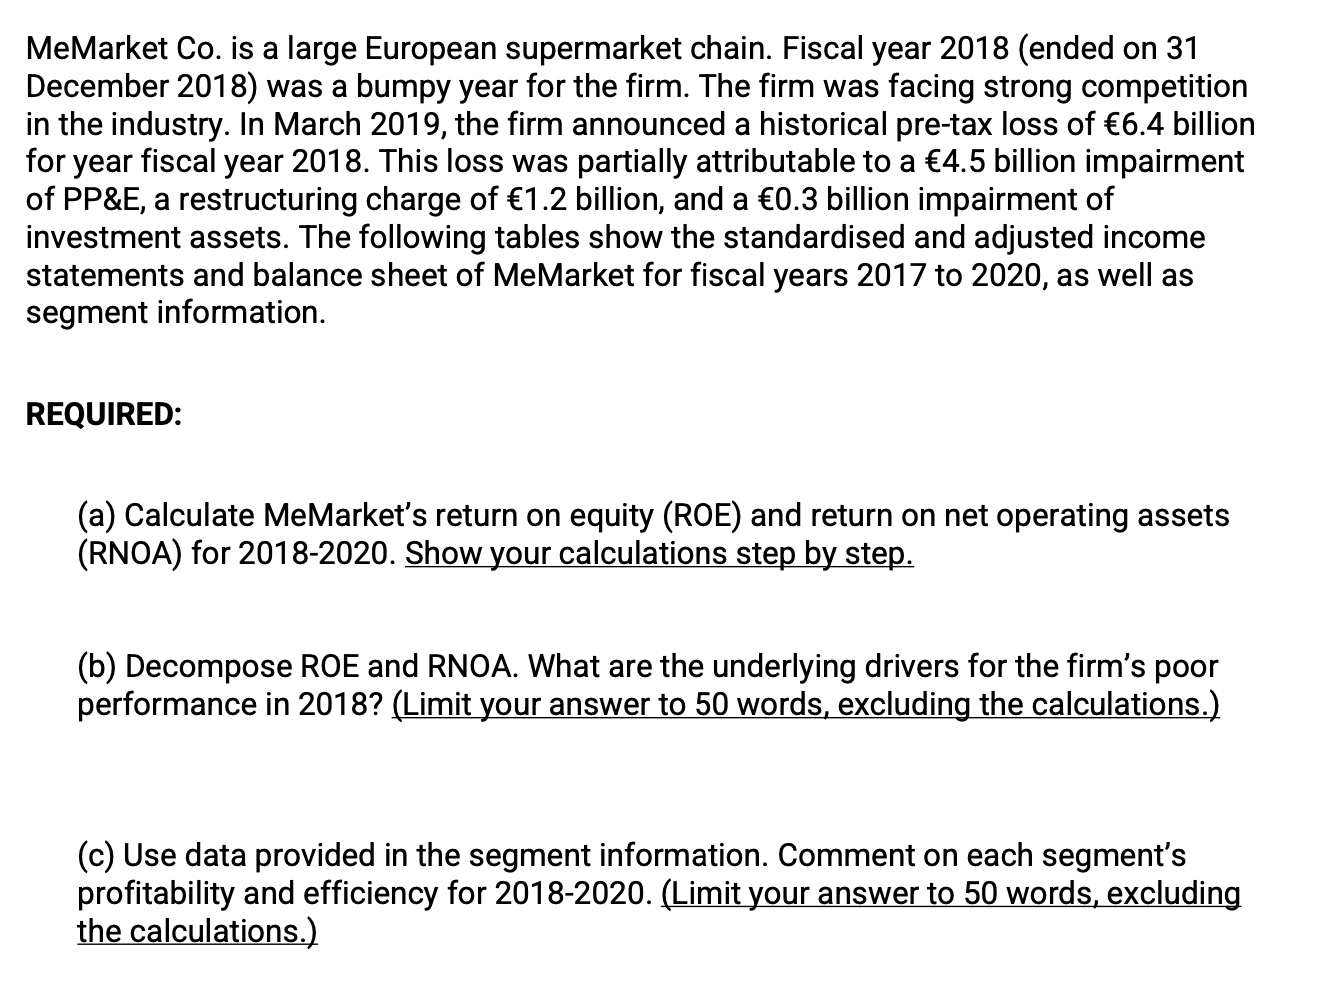
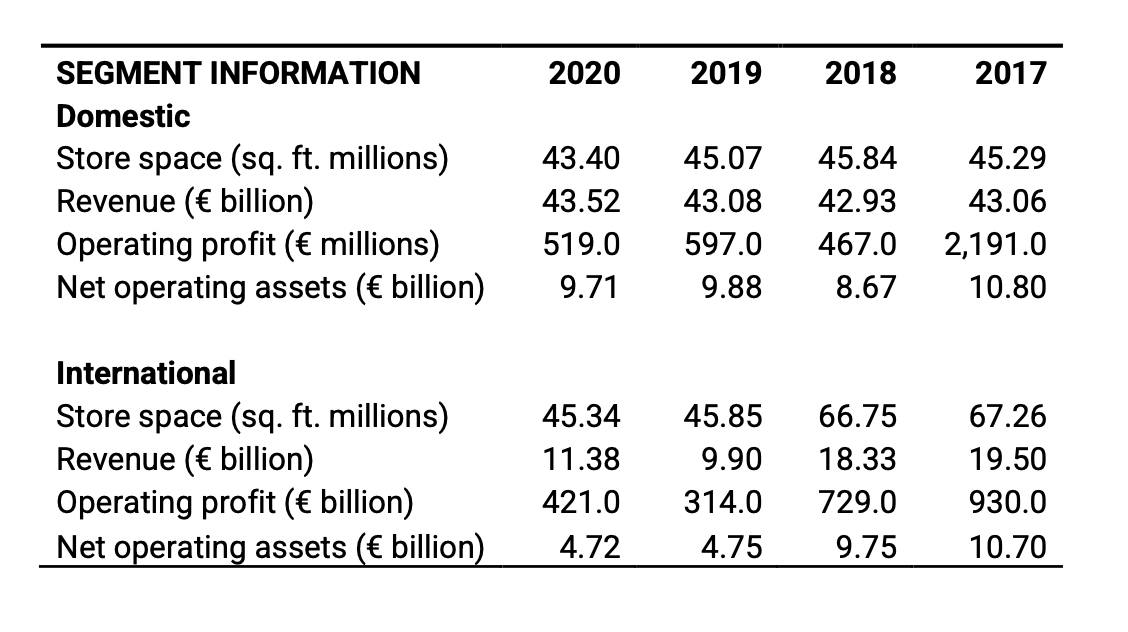
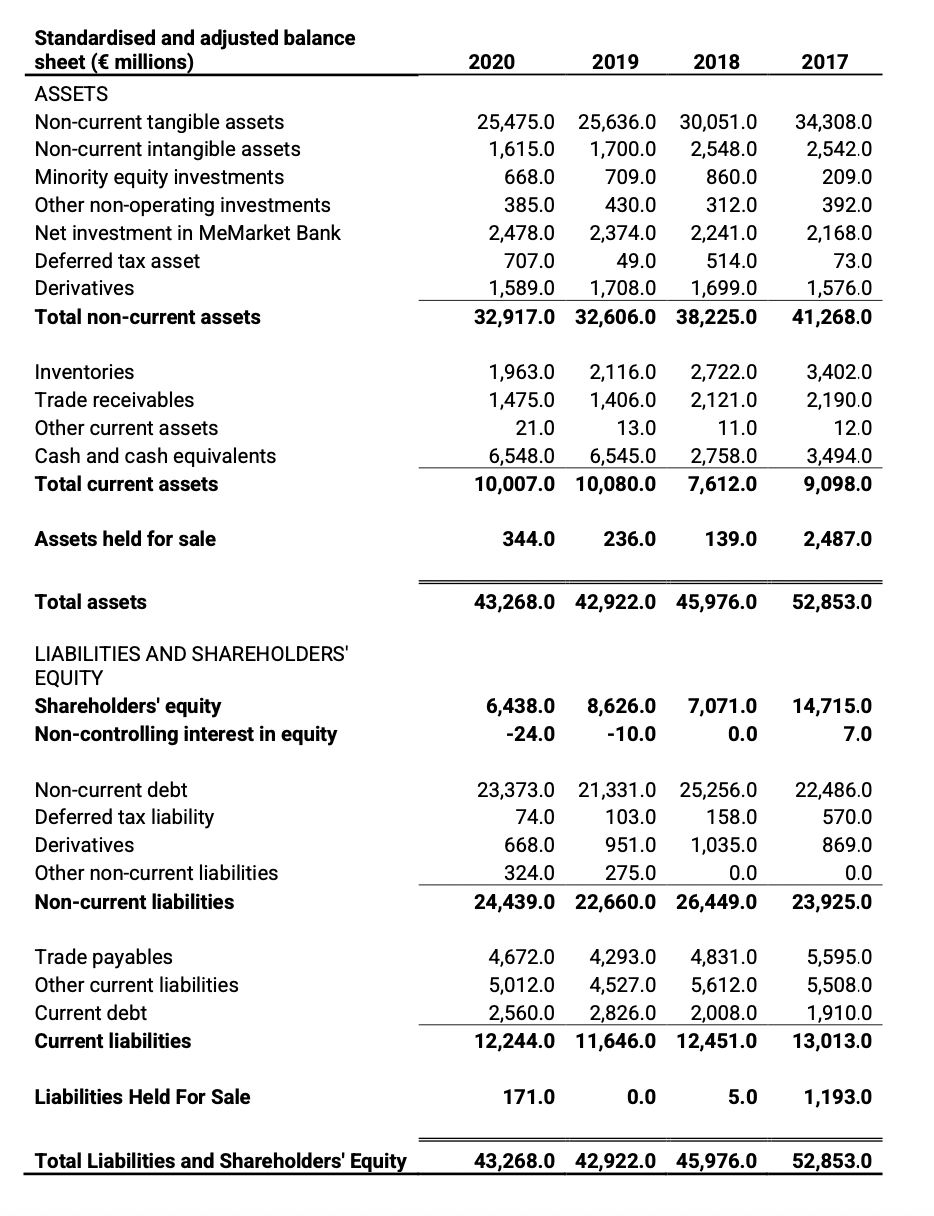
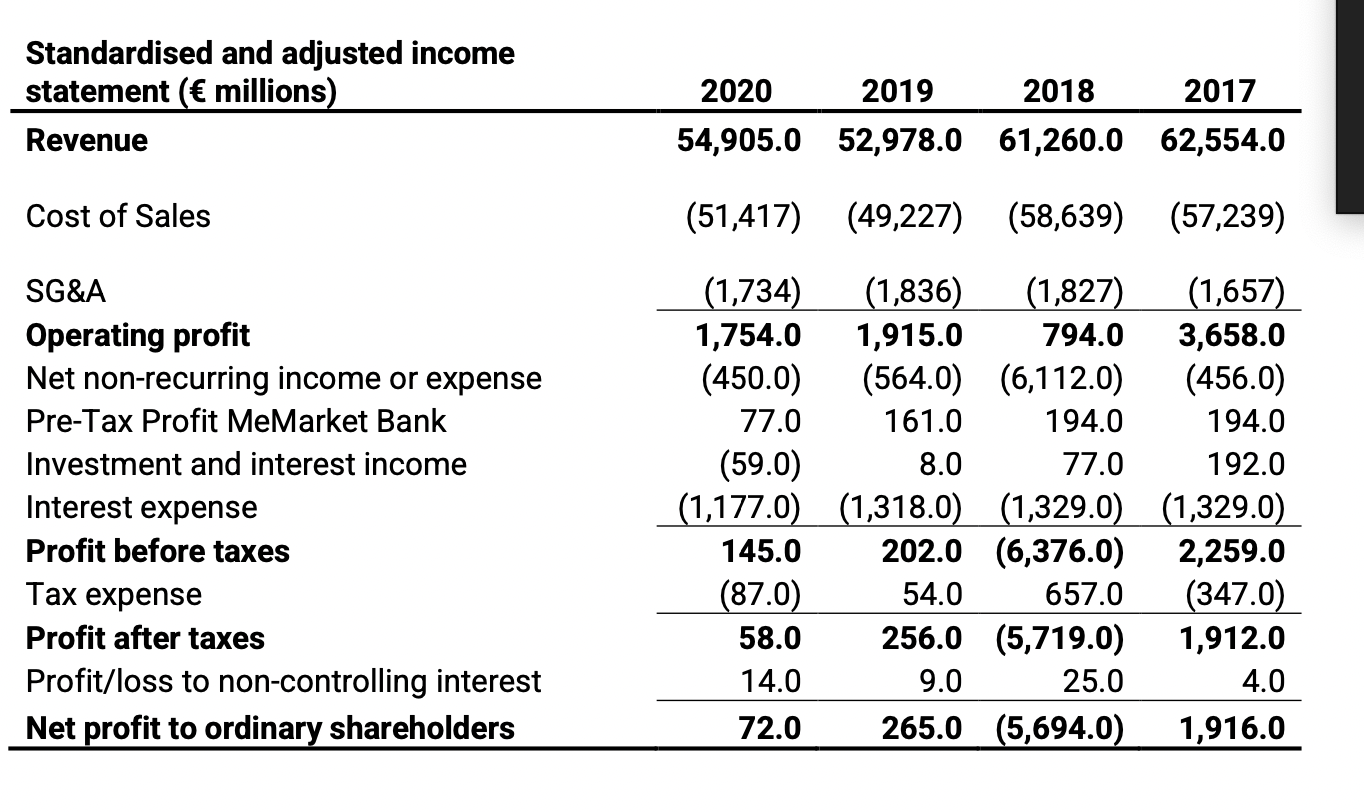
MeMarket Co. is a large European supermarket chain. Fiscal year 2018 (ended on 31 December 2018) was a bumpy year for the firm. The firm was facing strong competition in the industry. In March 2019, the firm announced a historical pre-tax loss of 6.4 billion for year fiscal year 2018. This loss was partially attributable to a {4.5 billion impairment of PP&E, a restructuring charge of 1 .2 billion, and a {0.3 billion impairment of investment assets. The following tables show the standardised and adjusted income statements and balance sheet of MeMarket for fiscal years 2017 to 2020, as well as segment information. REQUIRED: (a) Calculate MeMarket's return on equity (ROE) and return on net operating assets (RNOA) for 2018-2020. Show your calculations step by step. (b) Decompose ROE and RNOA. What are the underlying drivers for the firm's poor performance in 2018? (Limit your answer to 50 words. excluding the calculations.1 (c) Use data provided in the segment information. Comment on each segment's profitability and efficiency for 2018-2020. (Limit your answer to 51;) wordsexcluding h | | i n . SEGMENT INFORMATION 2020 2019 2018 2017 Domestic Store space (sq. ft. millions) 43.40 45.07 45.84 45.29 Revenue ({ billion) 43.52 43.08 42.93 43.06 Operating profit ({ millions) 519.0 597.0 467.0 2,191.0 Net operating assets ({ billion) 9.71 9.88 8.67 10.80 International Store space (sq. ft. millions) 45.34 45.85 66.75 67.26 Revenue ({ billion) 11.38 9.90 18.33 19.50 Operating profit ({ billion) 421.0 314.0 729.0 930.0 Net operating assets ({ billion) 4.72 4.75 9.75 10.70Standardised and adjusted balance sheet (( millions) 2020 2019 2018 2017 ASSETS Non-current tangible assets 25,475.0 25,636.0 30,051.0 34,308.0 Non-current intangible assets 1,615.0 1,700.0 2,548.0 2,542.0 Minority equity investments 668.0 709.0 860.0 209.0 Other non-operating investments 385.0 430.0 312.0 392.0 Net investment in MeMarket Bank 2,478.0 2,374.0 2,241.0 2,168.0 Deferred tax asset 707.0 49.0 514.0 73.0 Derivatives 1,589.0 1,708.0 1,699.0 1,576.0 Total non-current assets 32,917.0 32,606.0 38,225.0 41,268.0 Inventories 1,963.0 2,1 16.0 2,722.0 3,402.0 Trade receivables 1,475.0 1,406.0 2, 121.0 2,190.0 Other current assets 21.0 13.0 11.0 12.0 Cash and cash equivalents 6,548.0 6,545.0 2,758.0 3,494.0 Total current assets 10,007.0 10,080.0 7,612.0 9,098.0 Assets held for sale 344.0 236.0 139.0 2,487.0 Total assets 43,268.0 42,922.0 45,976.0 52,853.0 LIABILITIES AND SHAREHOLDERS' EQUITY Shareholders' equity 6,438.0 8,626.0 7,071.0 14,715.0 Non-controlling interest in equity -24.0 -10.0 0.0 7.0 Non-current debt 23,373.0 21,331.0 25,256.0 22,486.0 Deferred tax liability 74.0 103.0 158.0 570.0 Derivatives 668.0 951.0 1,035.0 869.0 Other non-current liabilities 324.0 275.0 0.0 0.0 Non-current liabilities 24,439.0 22,660.0 26,449.0 23,925.0 Trade payables 4,672.0 4,293.0 4,831.0 5,595.0 Other current liabilities 5,012.0 4,527.0 5,612.0 5,508.0 Current debt 2,560.0 2,826.0 2,008.0 1,910.0 Current liabilities 12,244.0 11,646.0 12,451.0 13,013.0 Liabilities Held For Sale 171.0 D.0 5.0 1, 193.0 Total Liabilities and Shareholders' Equity 43,268.0 42,922.0 45,976.0 52,853.0Standardised and adjusted income statement ({ millions) 2020 2019 2018 2017 Revenue 54,905.0 52,978.0 61,260.0 62,554.0 Cost of Sales (51,417) (49,227) (58,639) (57,239) SG&A (1,734) (1,836) (1,827) (1,657) Operating profit 1,754.0 1,915.0 794.0 3,658.0 Net non-recurring income or expense (450.0) (564.0) (6,112.0) (456.0) Pre-Tax Profit MeMarket Bank 77.0 161.0 194.0 194.0 Investment and interest income (59.0) 8.0 77.0 192.0 Interest expense (1,177.0) (1,318.0) (1,329.0) (1,329.0) Profit before taxes 145.0 202.0 (6,376.0) 2,259.0 Tax expense (87.0) 54.0 657.0 (347.0) Profit after taxes 58.0 256.0 (5,719.0) 1,912.0 Profit/loss to non-controlling interest 14.0 9.0 25.0 4.0 Net profit to ordinary shareholders 72.0 265.0 (5,694.0) 1,916.0