

Question: 9 . 1 1 through 9 . 1 2 Refer to Figure 9 . 2 9 . For the variables given, calculate and plot ,
through Refer to Figure For the variables given,
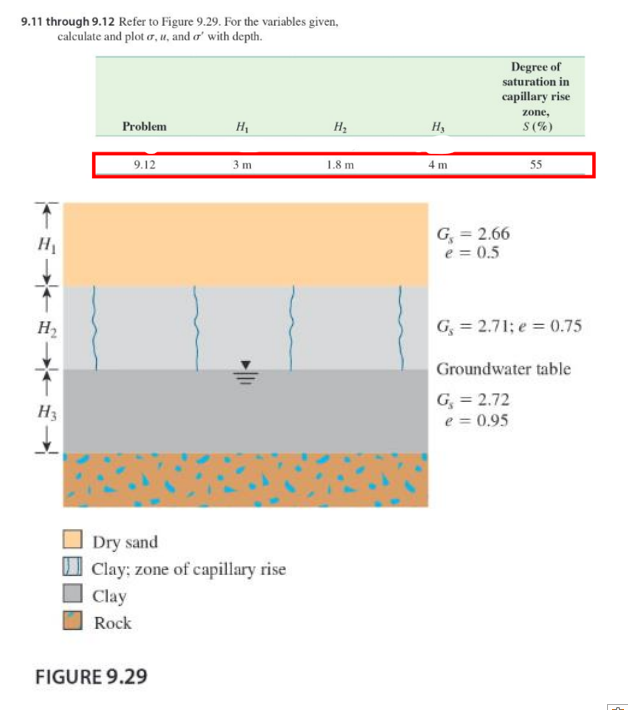
calculate and plot and with depth.
;
Groundwater table
Dry sand
Clay; zone of capillary rise
Clay
Rock
FIGURE Refer to Figure For the variables given, calculate and plot or u and er with depth
Step by Step Solution
There are 3 Steps involved in it
1 Expert Approved Answer
Step: 1 Unlock

Question Has Been Solved by an Expert!
Get step-by-step solutions from verified subject matter experts
Step: 2 Unlock
Step: 3 Unlock