

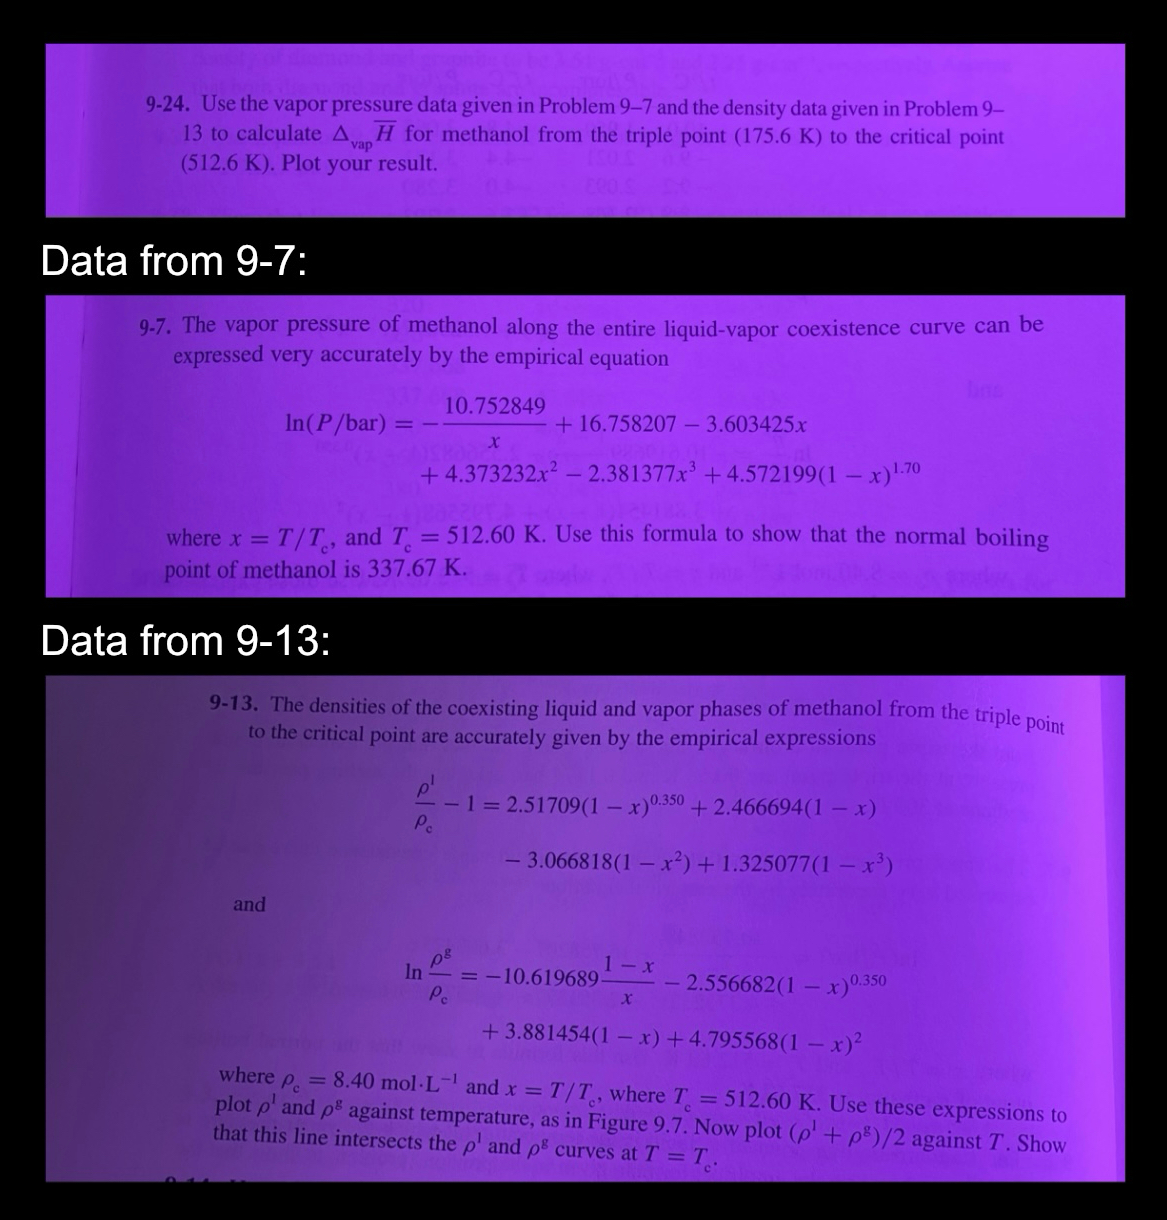
Question: 9 - 2 4 . Use the vapor pressure data given in Problem 9 - 7 and the density data given in Problem 9 1
Use the vapor pressure data given in Problem and the density data given in Problem to calculate for methanol from the triple point to the critical point K Plot your result.
Data from :
The vapor pressure of methanol along the entire liquidvapor coexistence curve can be expressed very accurately by the empirical equation
where and Use this formula to show that the normal boiling point of methanol is
Data from :
The densities of the coexisting liquid and vapor phases of methanol from the triple point to the critical point are accurately given by the empirical expressions
and
where mol and where Use these expressions to plot and against temperature, as in Figure Now plot against Show that this line intersects the and curves at
Step by Step Solution
There are 3 Steps involved in it
1 Expert Approved Answer
Step: 1 Unlock

Question Has Been Solved by an Expert!
Get step-by-step solutions from verified subject matter experts
Step: 2 Unlock
Step: 3 Unlock