

Question: (9, 4) thx Each graph illustrates three short run cost curves for firms, where ATC is average total cost (aka average cost), MC is marginal
(9, 4) thx
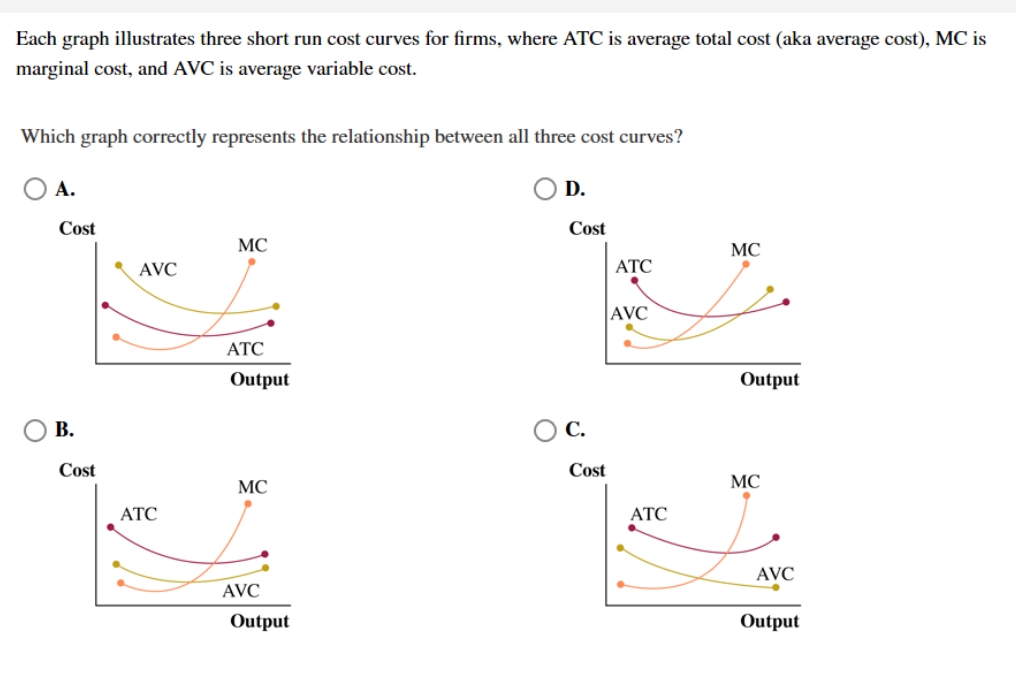
Each graph illustrates three short run cost curves for firms, where ATC is average total cost (aka average cost), MC is marginal cost, and AVC is average variable cost. Which graph correctly represents the relationship between all three cost curves? O A. OD. Cost MC Cost AVC ATC MC AVC ATC Output Output O B. O c. Cost MC Cost MC ATC ATC AVC AVC Output Output
Step by Step Solution
There are 3 Steps involved in it
1 Expert Approved Answer
Step: 1 Unlock

Question Has Been Solved by an Expert!
Get step-by-step solutions from verified subject matter experts
Step: 2 Unlock
Step: 3 Unlock