

Question: 9. (6 points) The following graph illustrates the expected decay of linkage disequilibrium for three separate pairs of loci. O 0.00 0.05 0.10 0.15 0.20
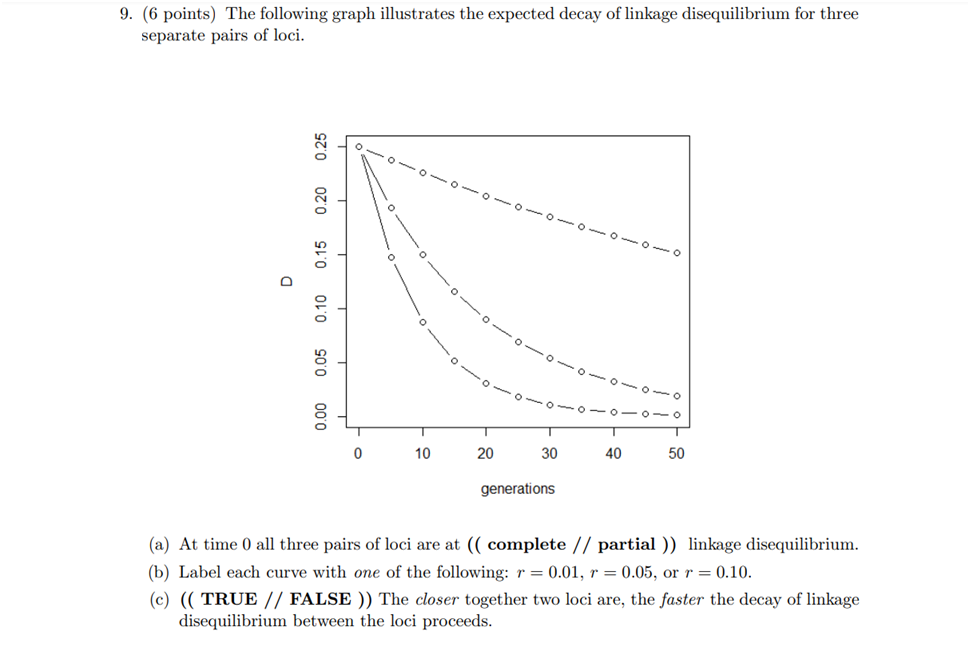 9. (6 points) The following graph illustrates the expected decay of linkage disequilibrium for three separate pairs of loci. O 0.00 0.05 0.10 0.15 0.20 0.25 ) =0- 0-0- 0 0 10 20 30 40 50 generations (a) At time 0 all three pairs of loci are at (( complete / / partial )) linkage disequilibrium. (b) Label each curve with one of the following: r = 0.01, r = 0.05, or r = 0.10. (c) (( TRUE // FALSE )) The closer together two loci are, the faster the decay of linkage disequilibrium between the loci proceeds
Step by Step Solution
There are 3 Steps involved in it
1 Expert Approved Answer
Step: 1 Unlock

Question Has Been Solved by an Expert!
Get step-by-step solutions from verified subject matter experts
Step: 2 Unlock
Step: 3 Unlock