

Question: 9 a b minimum 0 11 12 13 Determine the following values 15 2 4 on the life span of his pet cats 15 15

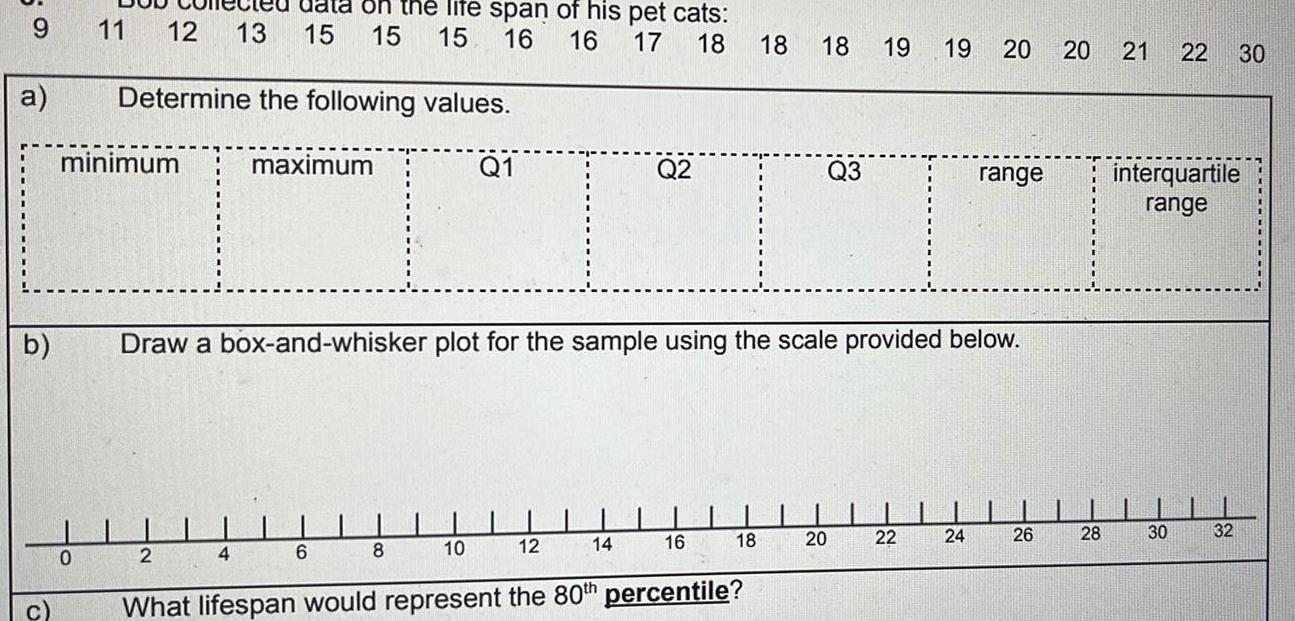
9 a b minimum 0 11 12 13 Determine the following values 15 2 4 on the life span of his pet cats 15 15 16 16 17 18 18 18 19 19 20 20 21 22 30 maximum 6 Q1 Draw a box and whisker plot for the sample using the scale provided below 8 12 Q2 14 16 18 10 What lifespan would represent the 80th percentile Q3 20 22 range 24 26 28 interquartile range 30 32
Step by Step Solution
There are 3 Steps involved in it
1 Expert Approved Answer
Step: 1 Unlock

Question Has Been Solved by an Expert!
Get step-by-step solutions from verified subject matter experts
Step: 2 Unlock
Step: 3 Unlock