

Question: 9 accompanying table to establish control limits for sample means and ranges for the filling process. Click the icon to view the table of factors
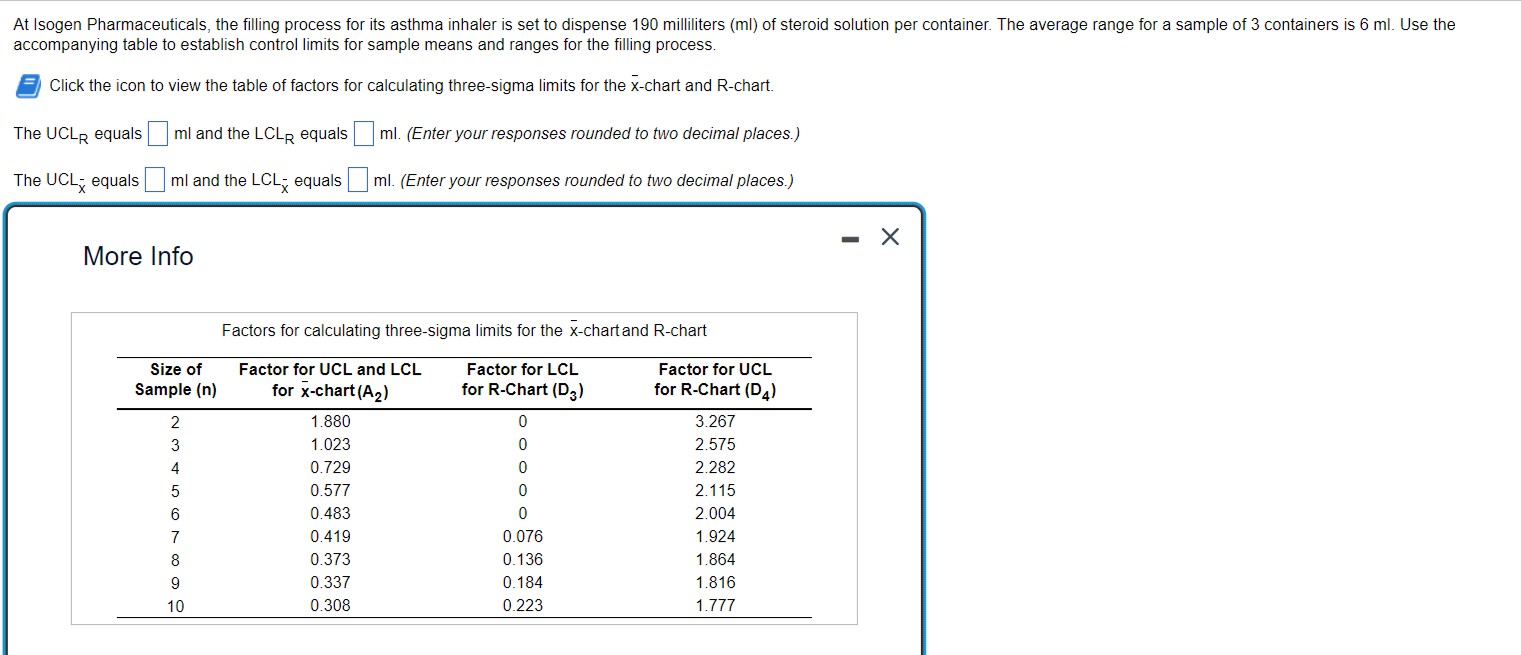
accompanying table to establish control limits for sample means and ranges for the filling process.
Click the icon to view the table of factors for calculating threesigma limits for the chart and Rchart.
The equals and the equals Enter your responses rounded to two decimal places.
The equals and the equals Enter your responses rounded to two decimal places.
More Info
Factors for calculating threesigma limits for the chart and chart
tabletableSize ofSample
Step by Step Solution
There are 3 Steps involved in it
1 Expert Approved Answer
Step: 1 Unlock

Question Has Been Solved by an Expert!
Get step-by-step solutions from verified subject matter experts
Step: 2 Unlock
Step: 3 Unlock