

Question: 9. consider the following table and interpret it: Table 2.7 Market Size and Average Winning Percentage in the National Basketball Association: 2004-05 to 2015-16 Variable
9. consider the following table and interpret it:
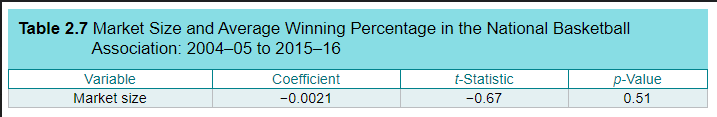

Table 2.7 Market Size and Average Winning Percentage in the National Basketball Association: 2004-05 to 2015-16 Variable Coefficient t-Statistic p-Value Market size -0.0021 -0.67 0.51Table 2.7 Market Size and Average Winning Percentage in the National Basketball Association: 2004-05 to 2015-16 Variable Coefficient t-Statistic p-Value Market size -0.0021 -0.67 0.51
Step by Step Solution
There are 3 Steps involved in it
1 Expert Approved Answer
Step: 1 Unlock

Question Has Been Solved by an Expert!
Get step-by-step solutions from verified subject matter experts
Step: 2 Unlock
Step: 3 Unlock