

Question: 9. Create a 2-D Column chart based on the range A5:E10. Move the 2-D Column chart to the Revenue Summary worksheet, and then resize and
9. Create a 2-D Column chart based on the range A5:E10. Move the 2-D Column chart to the Revenue Summary worksheet, and then resize and reposition the chart so the upper-left corner is located within cell A5 and the lower-right corner is located within cell K22. Select Switch Row/Column to edit the chart data source. Change the chart type to create a Custom Combination Combo chart. Represent the following data series as a Clustered Column chart: Life, Homeowners, Auto, and Travel, and represent the Total data series as a Line chart using the Secondary Axis. [Mac hint - Keep the main chart a Clustered Column chart, select the Total data series, change the chart type to a Line chart, and plot the series on the Secondary Axis.](in a MAC)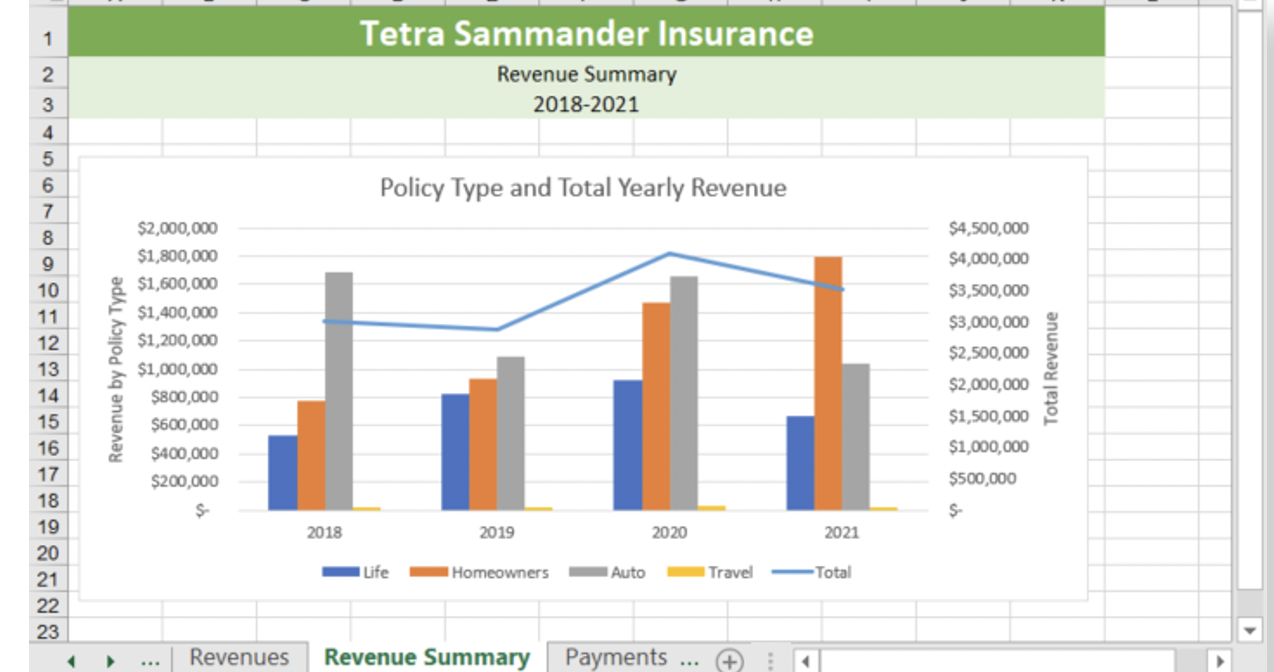
1 Tetra Sammander Insurance Revenue Summary 2018-2021 Policy Type and Total Yearly Revenue 2 3 4 5 6 7 8 9 10 11 12 13 14 15 16 17 18 19 20 21 22 23 Revenue by Policy Type $2,000,000 $1,800,000 $1,600,000 $1,400,000 $1,200,000 $1,000,000 $800,000 $600,000 $400,000 $200,000 $ $4,500,000 $4,000,000 $3,500,000 $3,000,000 $2,500,000 $2,000,000 $1,500,000 $1,000,000 $500,000 Total Revenue S- 2018 2019 2020 2021 Life Homeowners Auto Travel Total Revenues Revenue Summary Payments
Step by Step Solution
There are 3 Steps involved in it

Get step-by-step solutions from verified subject matter experts