

Question: 9. Create a histogram Sdius a. Click the Sales Forecast sheet tab and select cell G13 b. Create a bin range of 10 values starting
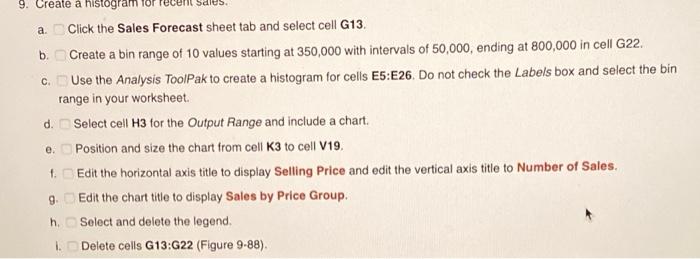
9. Create a histogram Sdius a. Click the Sales Forecast sheet tab and select cell G13 b. Create a bin range of 10 values starting at 350,000 with intervals of 50,000, ending at 800,000 in cell G22. c. Use the Analysis ToolPak to create a histogram for cells E5E26. Do not check the Labels box and select the bin range in your worksheet. d. Select cell H3 for the Output Range and include a chart. Position and size the chart from cell K3 to cell 019 + Edit the horizontal axis title to display Selling Price and edit the vertical axis title to Number of Sales. 9. Edit the chart title to display Sales by Price Group. h. Select and delete the legend. 1. Delete cells G13:G22 (Figure 9-88). e. 9. Create a histogram Sdius a. Click the Sales Forecast sheet tab and select cell G13 b. Create a bin range of 10 values starting at 350,000 with intervals of 50,000, ending at 800,000 in cell G22. c. Use the Analysis ToolPak to create a histogram for cells E5E26. Do not check the Labels box and select the bin range in your worksheet. d. Select cell H3 for the Output Range and include a chart. Position and size the chart from cell K3 to cell 019 + Edit the horizontal axis title to display Selling Price and edit the vertical axis title to Number of Sales. 9. Edit the chart title to display Sales by Price Group. h. Select and delete the legend. 1. Delete cells G13:G22 (Figure 9-88). e
Step by Step Solution
There are 3 Steps involved in it

Get step-by-step solutions from verified subject matter experts