

Question: 9. Create a Pressure vs Depth seatterplot {with a headline) for the data m paste the scatterplot below. 10. In the trendline gathered above, does
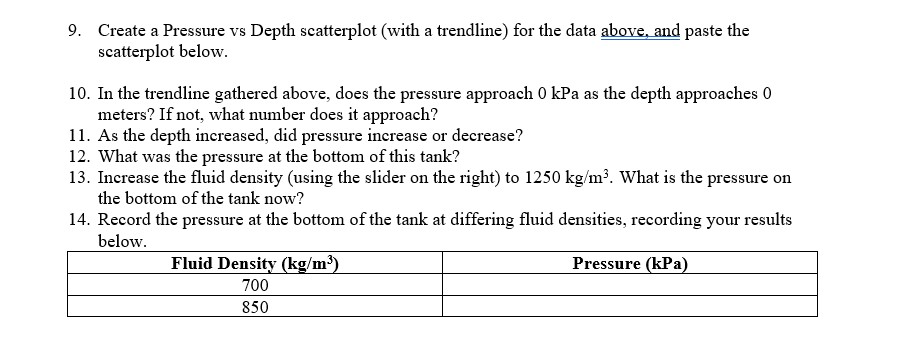

9. Create a Pressure vs Depth seatterplot {with a headline) for the data m paste the scatterplot below. 10. In the trendline gathered above, does the pressure approach 0 kPa as the depth approaches 0 meters? If not, what number does it approach? 11. As the depth increased, did pressure increase or decrease? 12. What was the pressure at the bottom of this tank? 13. Increase the uid density (using the slider on the right) to 1250 kgfm3. 1What is the pressure on the bottom of the tank now? 14. Record the pressure at the bottom of the tank at differing uid densities, recording your results below. Fluid Density [light-3) Pressure (kl'a) 700 850
Step by Step Solution
There are 3 Steps involved in it
1 Expert Approved Answer
Step: 1 Unlock

Question Has Been Solved by an Expert!
Get step-by-step solutions from verified subject matter experts
Step: 2 Unlock
Step: 3 Unlock