

Question: '9 Do Homework 7 ASSESS Chapter 7 Chapter Problems 7 Google Chrome a mylabpearsonLom ' i 7 i 7 Econ 100 Online Fall 2022 Alyssa
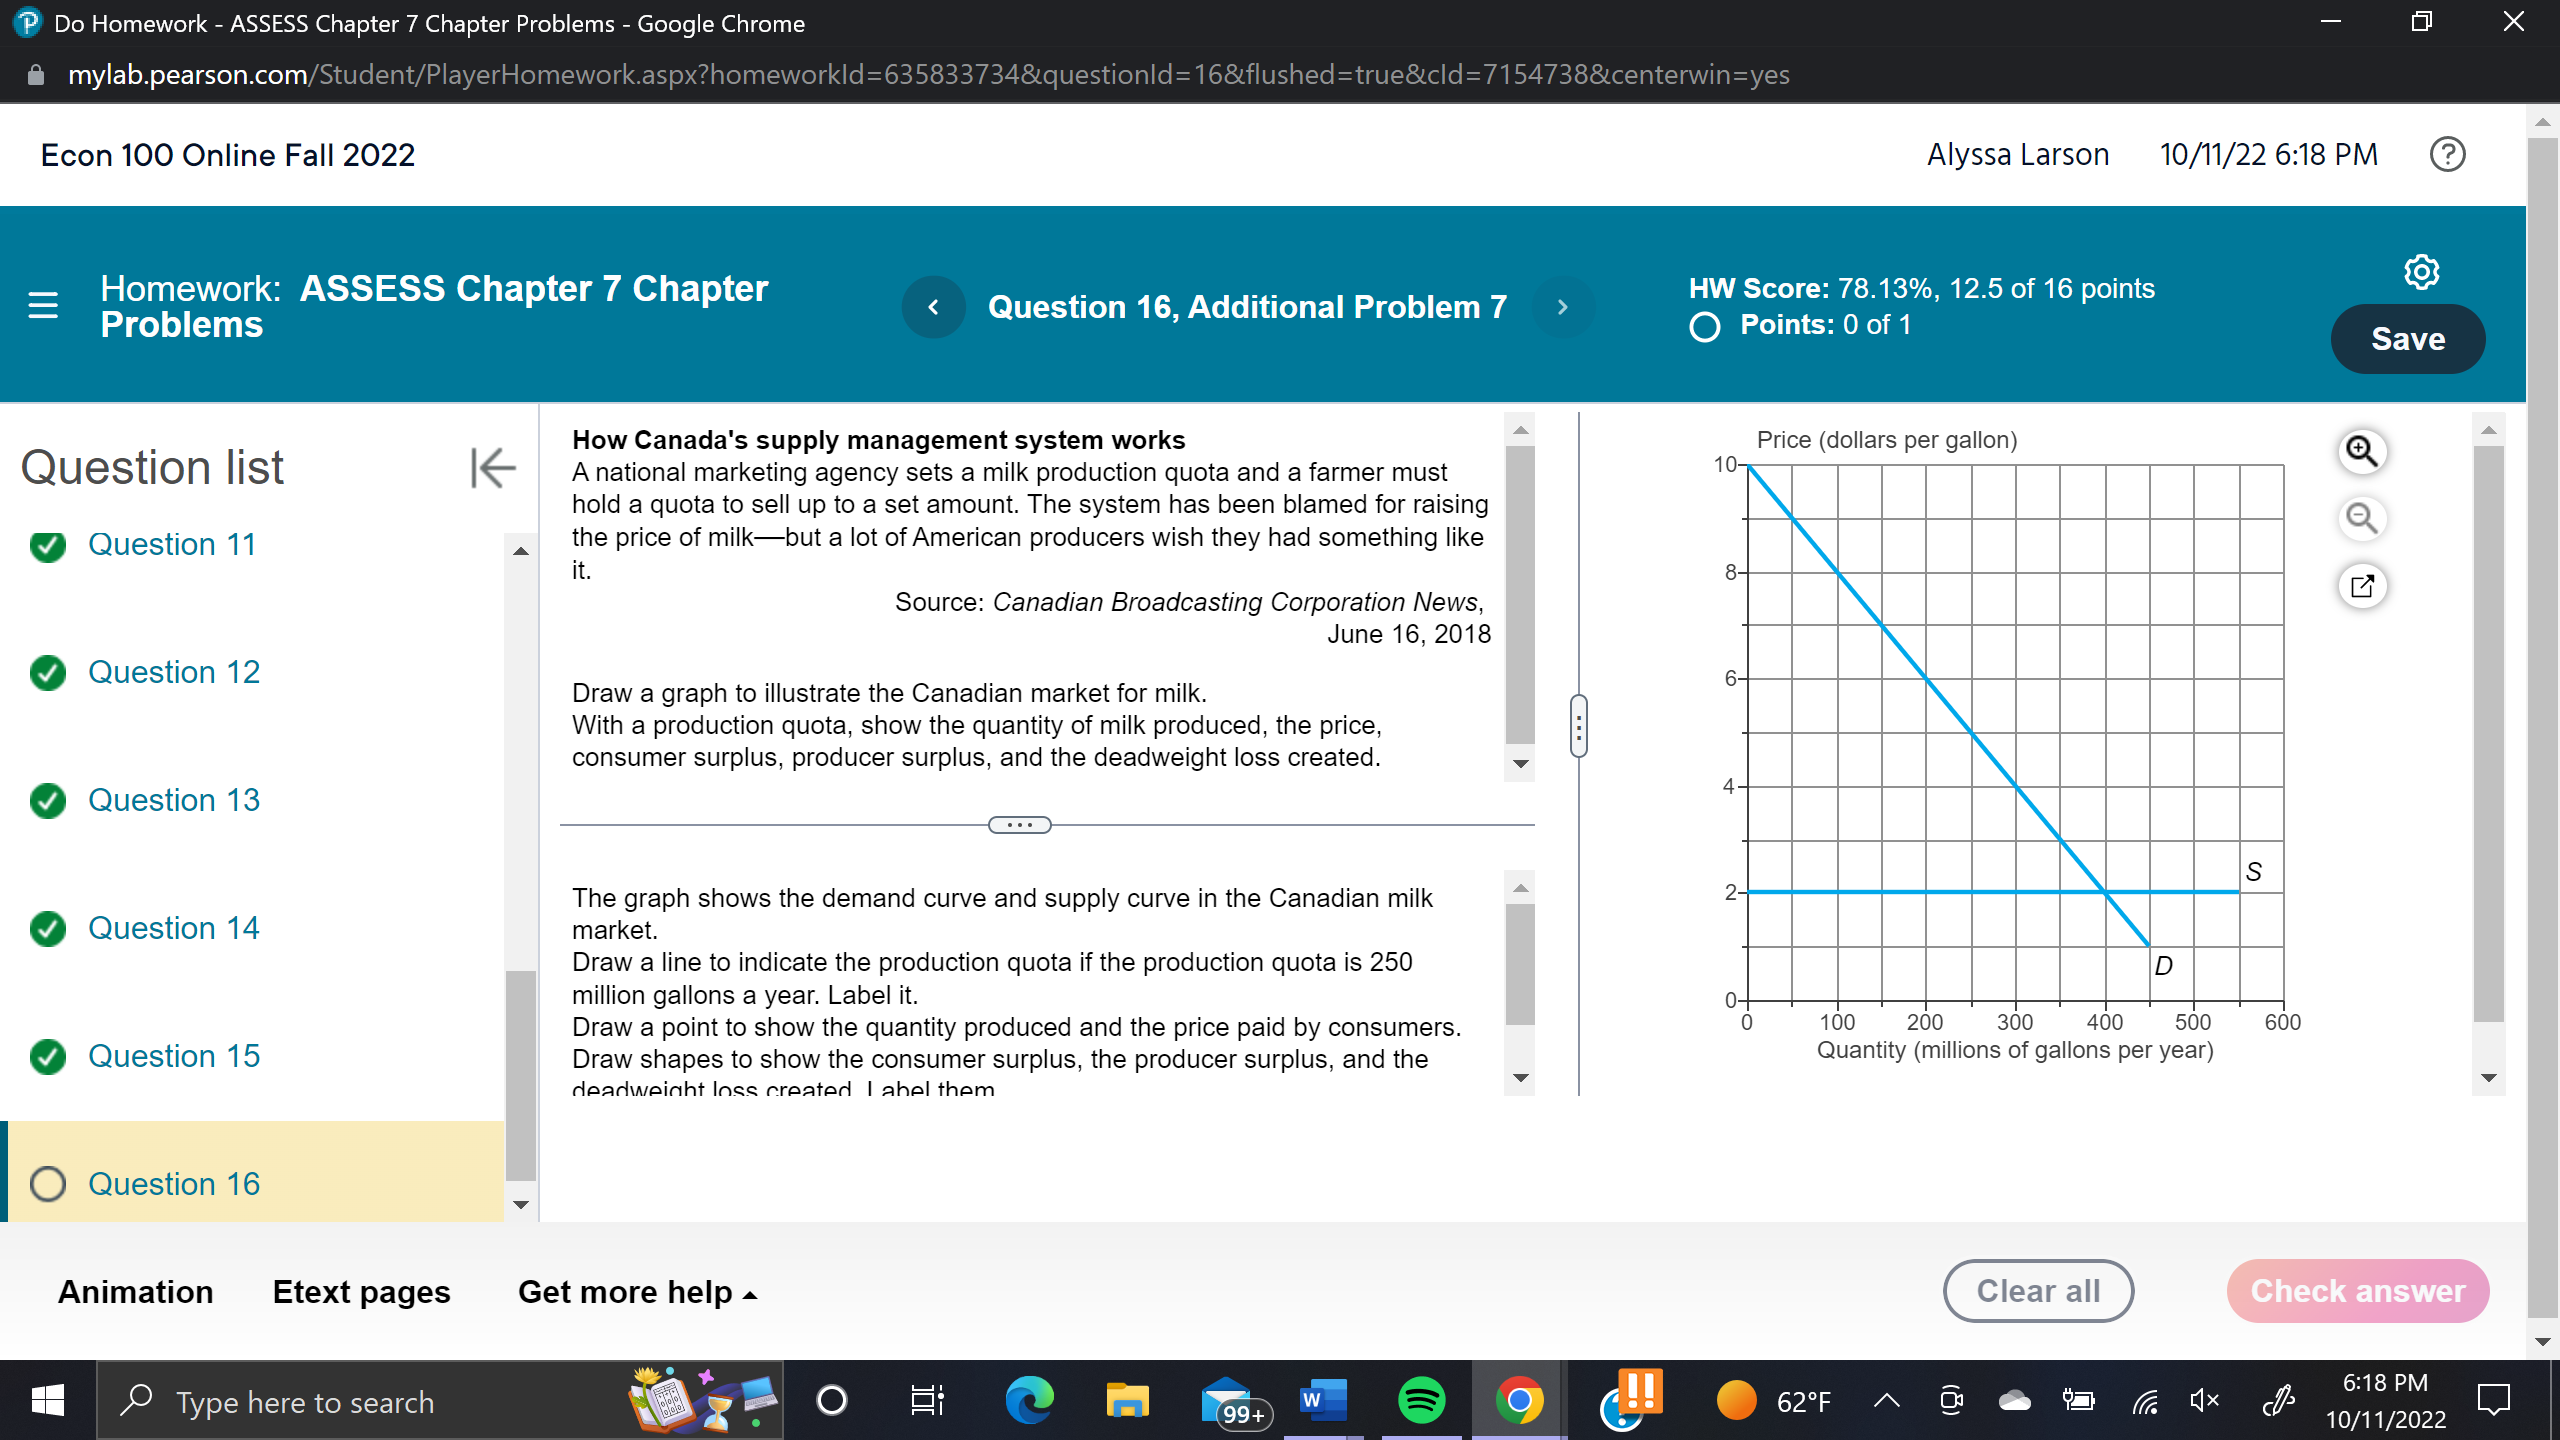
'9 Do Homework 7 ASSESS Chapter 7 Chapter Problems 7 Google Chrome a mylabpearsonLom ' i 7 i 7 Econ 100 Online Fall 2022 Alyssa Larson 10/11/22 6:18 PM Homework: ASSESS Chapter 7 Chapter HW Score: 78.13%, 12.5 of 16 points Question 16, Additional Problem 7 Problems 0 Points: 0 of 1 , _ How Canada's supply management system works \\ Price (dollars per gallon) 0' \"' Questlon \"St '6 A national marketing agency sets a milk production quota and a farmer must 10 hold a quota to sell up to a set amount The system has been blamed for raising Q 0 Question 11 A the price of milkbut a lot ofAmerican producers wish they had something like it. a , Source: Canadian Broadcasting Corporation News, D June 16, 2018 Question 12 0 Draw a graph to illustrate the Canadian market for milk. 6 With a production quota, show the quantity of milk produced, the price, consumer surplus, producer surplus, and the deadweight loss created. v 0 Question 13 4 S The graph shows the demand curve and supply cun/e in the Canadian milk L 2 0 Question 14 market. Draw a line to indicate the production quota if the production quote is 250 D million gallons a year. Label it. 0 _ Draw a point to show the quantity produced and the price paid by consumers. 0 10 , 209 ' 300 400 500 500 0 Question 15 Draw shapes to show the consumer surplus, the producer surplus, and the Quantity lm'll'\"s Of gallons per year) (loadwoinht lnss nraatorl | ahal thorn v v 0 Question 16 Animation Etext pages Get more help A 6:18 PM /0 Type here to search 7 10/11/2022 l:l
Step by Step Solution
There are 3 Steps involved in it

Get step-by-step solutions from verified subject matter experts